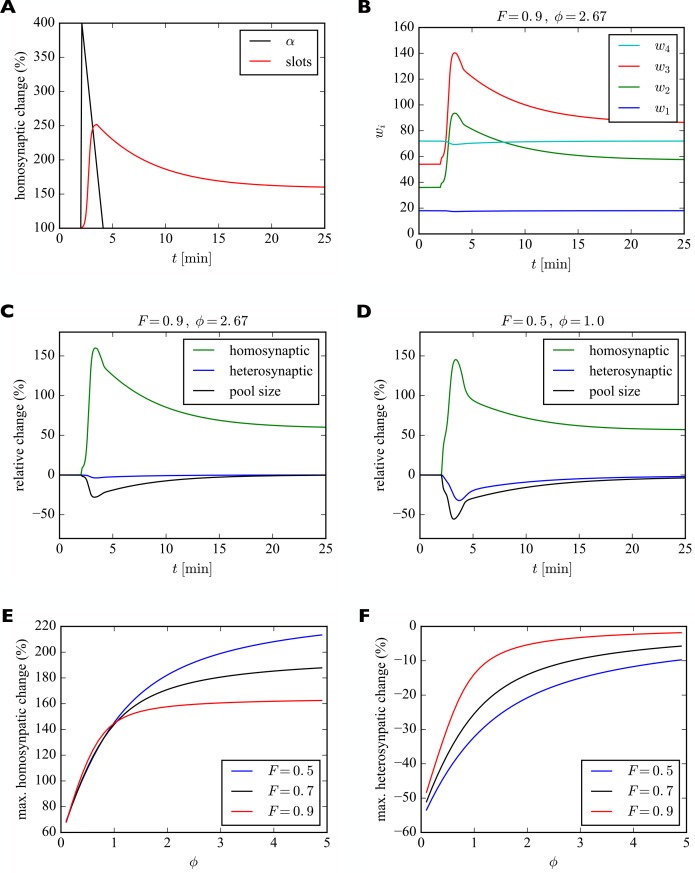
Figure 6. Model of homosynaptic LTP accompanied by heterosynaptic LTD.
After 2 min, LTP is induced in synapses 2 and 3. This entails a transient synapse-specific change in the insertion rate of these synapses and a gradual change in their slot numbers. (A) Time course of relative change of receptor insertion rate and slot numbers of stimulated synapses undergoing homosynaptic LTP. (B) Time course of synaptic efficacies for a filling fraction of and a relative pool size of . Only a very small amount of heterosynaptic LTD can be observed in unstimulated synapses 1 and 4. (C) Relative change of synaptic efficacies and pool size due to homosynaptic LTP and heterosynaptic LTD in B as a function of time. (D) Same as C but for a smaller filling fraction of and a smaller relative pool size of . Note the smaller transient increase in efficacy of potentiated synapses (compare peaks of green curves in C and D) and the increased amount of heterosynaptic LTD (compare troughs of blue curves). (E, F) Maximum amount of homosynaptic LTP (E) and heterosynaptic LTD (F) as a function of relative pool size for three different filling fractions.

