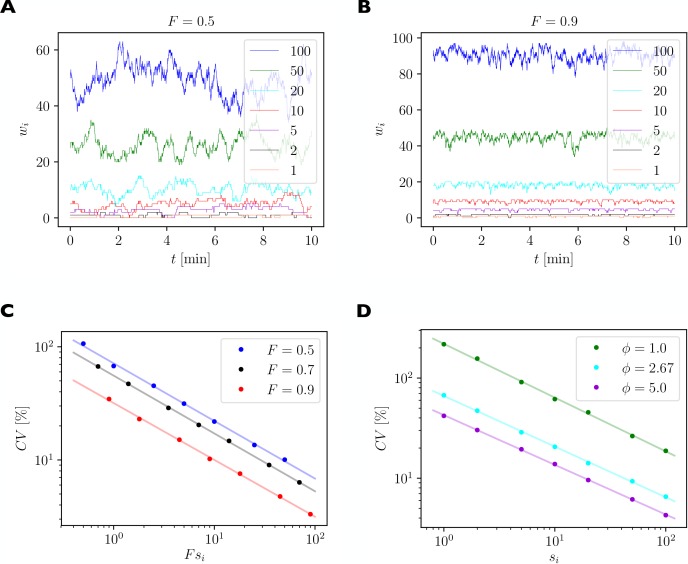
Figure 8. Quantification of spontaneous synaptic efficacy fluctuations due to the fast exchange of receptors between synapses and the receptor pool.
(A) Example simulation of a piece of dendrite with 7 synapses during 10 min of simulated time. The number of receptor slots in each synapse is given in the legend. The relative pool size was set to and the filling fraction was set to by choosing the binding rate to receptor slots via Equation 13. (B) Same as A. but for a higher filling fraction of . (C) Size of synaptic efficacy fluctuations as measured by the coefficient of variation (CV) as a function of the steady state number of receptors in each synapse, which is given by the product of the filling fraction and the number of slots in synapse . The relative pool size was set to . Data points represent averages over 10 simulations of 30 min simulated time each. Lines represent linear fits through the data points in double log space. (D) CV as a function of steady state number of receptors for different relative pool sizes achieved by holding the binding rate to receptor slots fixed and varying the externalization rate .

