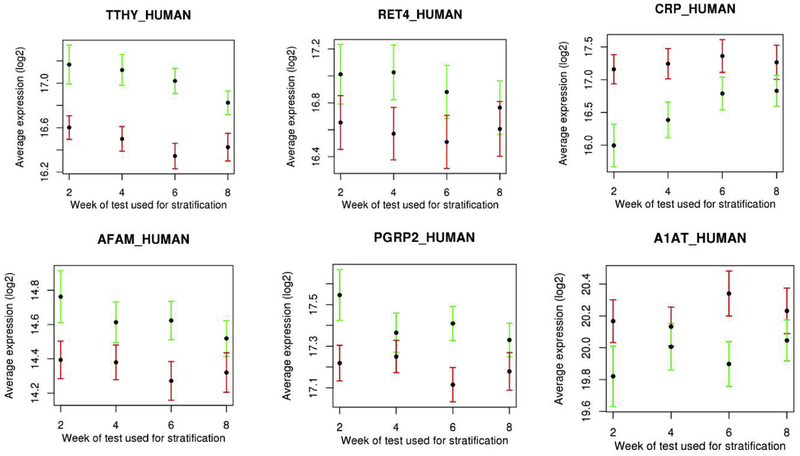
Fig. 5.
Plots of 6 serum proteins measured at baseline with highest significance in discriminating subsequent culture status across all culture time points. Black dots represent the average log2 protein abundance for that protein, red error bars (standard deviation) represent positive culture status patients, where green error bars represent patients with negative culture status. (For interpretation of the references to colour in this figure legend, the reader is referred to the Web version of this article.)

