Figure 6.
Pointwise surface distance (PSD) analysis.
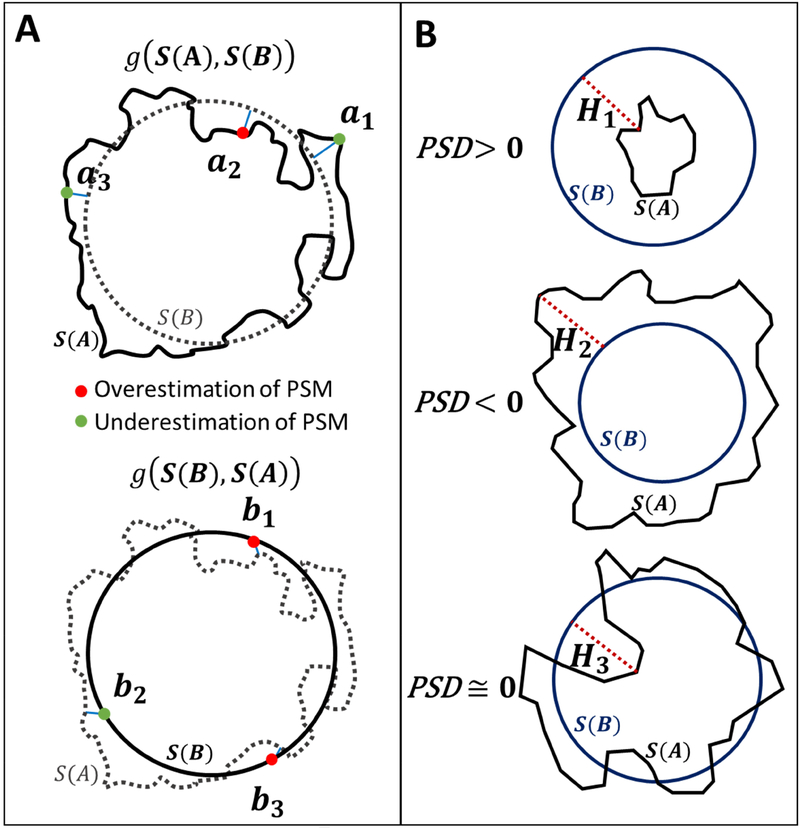
(A) Schematic of the one-sided PSD analysis. S(A), and S (B) are the boundaries of MRA and reconstructed parametric structured mesh (PSM) regions, respectively. The top panel represents the one-sided PSD from S(A) to S(B). The green and red points indicate under and overestimation of PSM at each point, respectively. The modified Hausdorff distance (HD) from {a1, a2, a3} to their nearest point in S(B) are visualized in solid blue lines. Points {a1,a3} ∉ B indicates underestimated of PSM diameter for those specific points. In the lower panel, we calculated the one-sided PSD from S(B) to S(A) as the minimum distance from {b1,b2,…,bm} ∈ S(B) to their nearest neighbor in S(A).
(B) A schematic of the difference between HD and PSD computations. Three different cross-sectional vessel samples gives exactly the same HD are shown in red-dotted lines (H1 = H2 = H3), which is an unsatisfactory result. In contrast, the PSD index enables correct quantification of diameter estimation error for assessing PSM reconstruction against the MRA images as the gold standard. Positive PSD index indicates overestimation, PSD > 0, shown on the top. Dimensions are underestimated when it is negative, PSD < 0, as depicted in the middle row. In the lower panel an example of accurate diameter approximation PSD ≅ 0, is shown.

