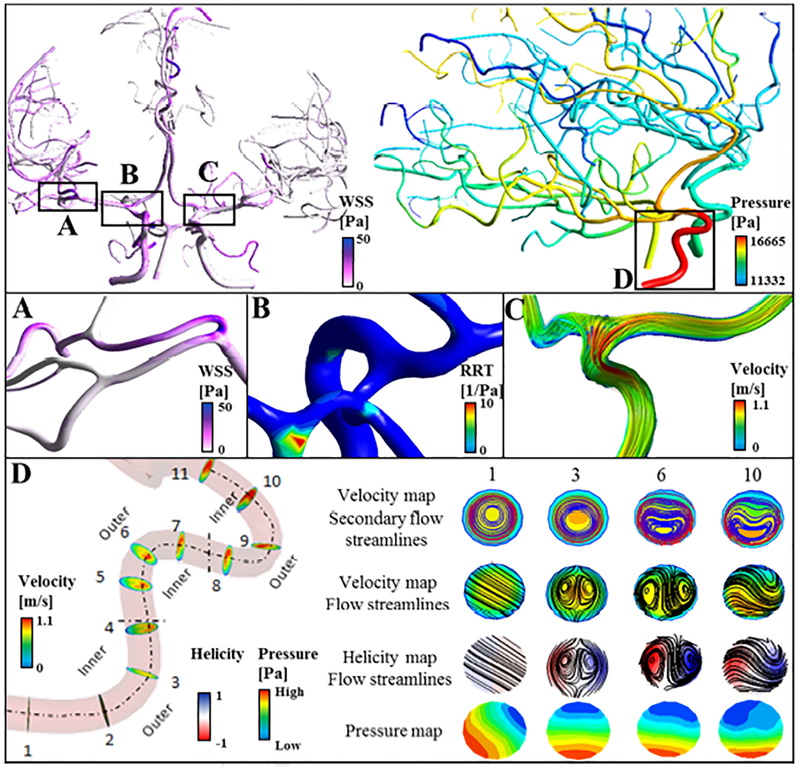
Figure 9.
Preliminary 3D computational analysis. Validated reconstructed cerebral arterial trees were used for hemodynamic analysis. (A) Distribution of wall shear stress for a small portion of right middle cerebral arteries, MCA. (B) Elevated relative residence time (RRT) in the basilar artery. (C) Blood flow streamlines in the M 1 branch of left MCA. (D) Development of secondary flow in the high-tortuous right internal carotid artery. Vorticity and normalized helicity are shown in select planes. Cross-sectional views in sample location 1, 3, 6 and 10 are scaled to the same diameter for better visualization. In the vessels with high curvature, blood circulates from the inner wall towards the outer wall forming recirculation zones.

