Figure 1.
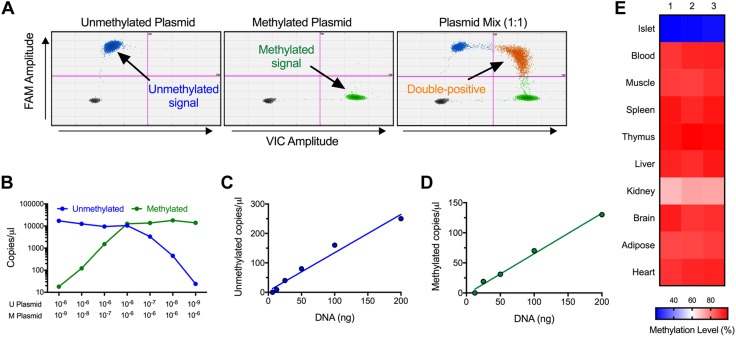
Mouse DMD assay specificity and validation. A) Two-dimensional plots with plasmid standards for unmethylated and methylated mouse Ins2 DNA and for a 1:1 mixture of the 2 plasmids. Arrows identify the unmethylated, methylated, and unmethylated + methylated (double-positive) Ins2 DNA-containing droplets. B) Quantitation of plasmid dilution curves, presented as copies per microliter. C, D) Quantitation of dilution curves of serum spiked with mouse DNA for unmethylated Ins2 DNA (C) and methylated Ins2 DNA (D). R2 = 0.9733 for unmethylated Ins2 DNA and R2 = 0.9917 for methylated Ins2 DNA. E) Quantification of methylation status in primary mouse tissues.

