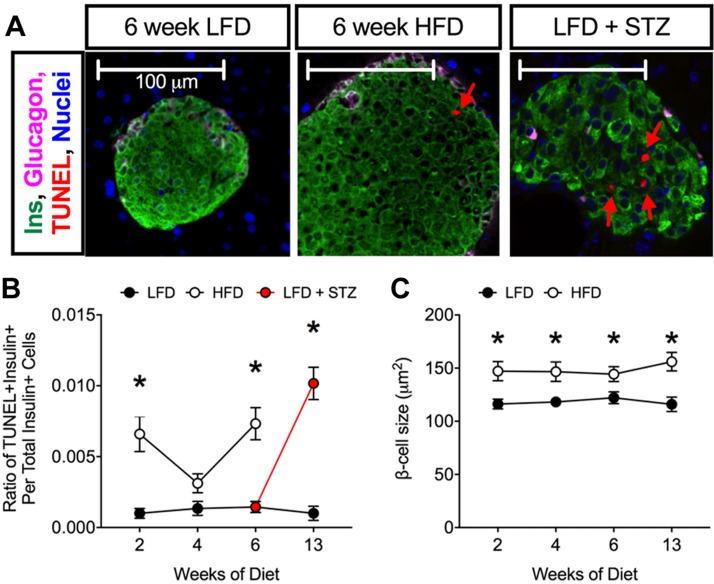
Figure 4.
TUNEL staining during LFD and HFD feeding in C57BL/6J mice. A) Representative images of pancreata stained for insulin (green), glucagon (pink), TUNEL (red), and DAPI (blue). B) Ratio of TUNEL + insulin+ cells to total insulin+ cells; n = 4 mice for immunostaining, 5 sections/animal. C) Average β-cell size. P < 0.01 by 2-way ANOVA for the comparison of the HFD to LFD values in B. Data are presented as means ± sem. *P < 0.05 for HFD compared with LFD or for LFD–STZ compared with LFD.

