Figure 1.
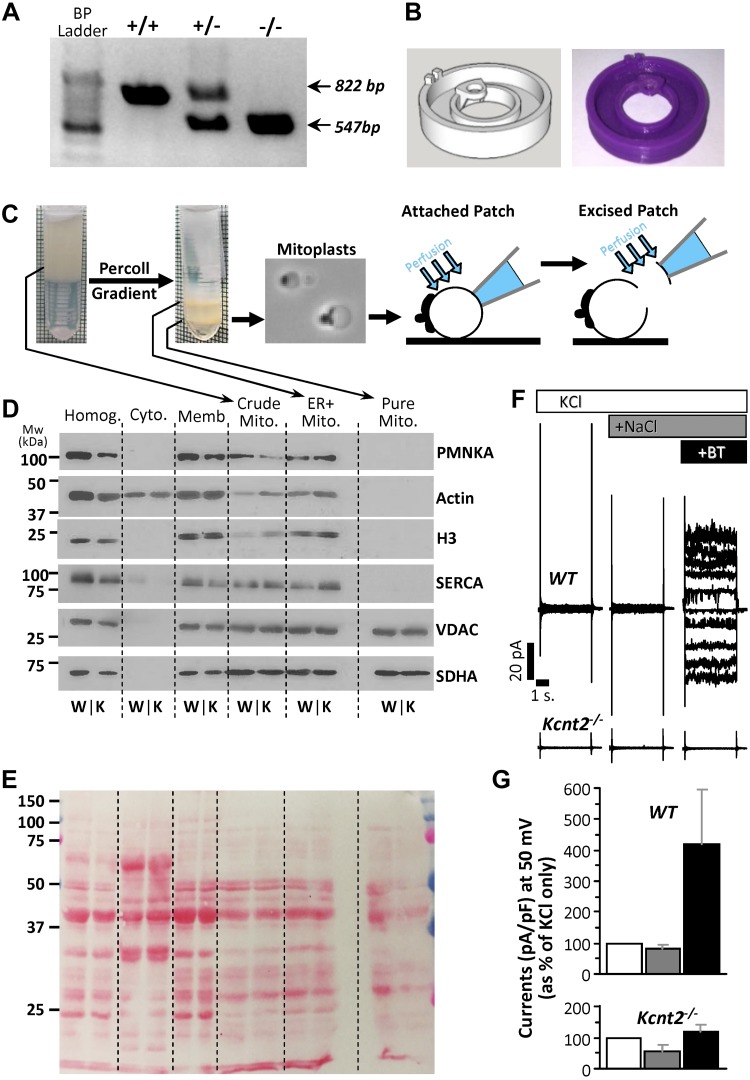
Kcnt2−/− mice, mitoplast purification and attached patch clamp. A) Example PCR analysis of tail clip genotyping of WT, heterozygous, and Kcnt2−/− mice. Amplicon expected for the WT (822 bp) and the knockout (547 bp) alleles. B) Custom 3-D–printed micro chamber for patch-clamp analysis of mitoplasts with computer model (left) and final product (right). C) Schematic depicting mitochondrial purification, mitoplast preparation, and attached patch and excised patch configuration. D) Western blot analysis of proteins from different cellular fractions during mitochondrial purification. Crude Mito, mitochondria-enriched fraction; Cyto, cytosol; ER+Mito, upper band following Percoll; [H3], Histone; Homog, homogenate; Memb, crude membrane; Pure Mito, lower band following Percoll. PMNKA, plasma membrane Na+/K+-ATPase; SERCA, sarcoendoplasmic reticulum Ca2+-ATPase; VDAC, voltage-dependent anion channel. E) Ponceau Red–stained membrane from blot in D for the loading control. (An empty lane was inserted between the ER+mit and Pure Mito samples.) F) Representative recordings from attached patch clamp of WT and Kcnt2−/− mitoplasts, with perfusion of 150 mM KCl (white), after addition of 40 mM NaCl (dark gray), and after addition of 10 µM BT (black). G) Quantitation of traces normalized to pA/pF and shown as percentage increase in current at a holding potential of 50 mV (same color scheme as F). Data are means ± sd (n = 4–10 independent mitoplast preparations).

