Figure 3.
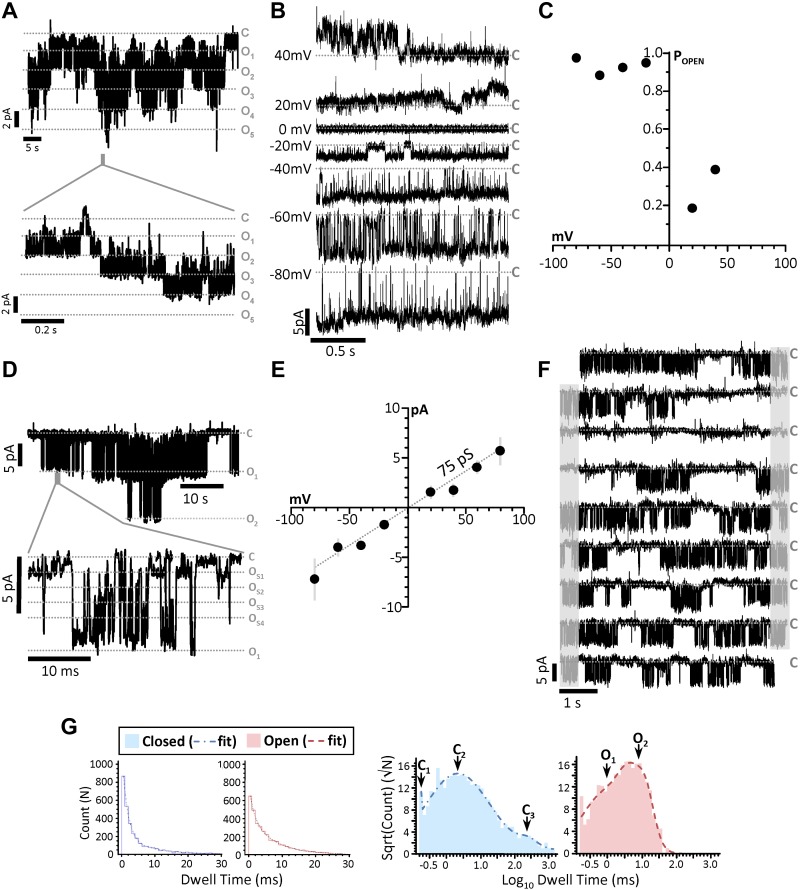
Single-channel characteristics of mitochondrial KNa1.2. A) Compressed traces from the recording of a patch containing 5 mitochondrial KNa1.2 channels (holding potential, −20 mV), and a time-expanded trace for the region highlighted by the gray bar in the trace above. Gray dashed lines: closed (C) and multiple open (O) states. B) Traces from a single KNa1.2 channel at holding potentials of 40 to −80 mV. C) Channel open probability plot from the channel shown in B. D) Representative trace of a recording with 2 channels on a compressed time scale (holding potential −40 mV) and a time-expanded trace for the region highlighted by the gray bar in the trace above, showing multiple subconductance states within the channel peak conductance (e.g., OS1). E) Current–voltage relationship of all 6 mito-KNa1.2 channels showing average current at each holding potential. The decreased slope conductance (compared to Fig. 2H showing peak unitary conductance) indicates that subconductances averaging 75 pS dominated the average current during the recordings. F) Continuous trace (45 s) of a single channel. Gray shading: portions of each trace (right) that are repeated (left) on the next line. Gray dashed lines labeled C: closed states. G) Log binned channel closed and open dwell-time peaks and frequency of closed dwell times plotted against their duration. Table inset shows calculated area and time constants (τ).

