Figure 5.
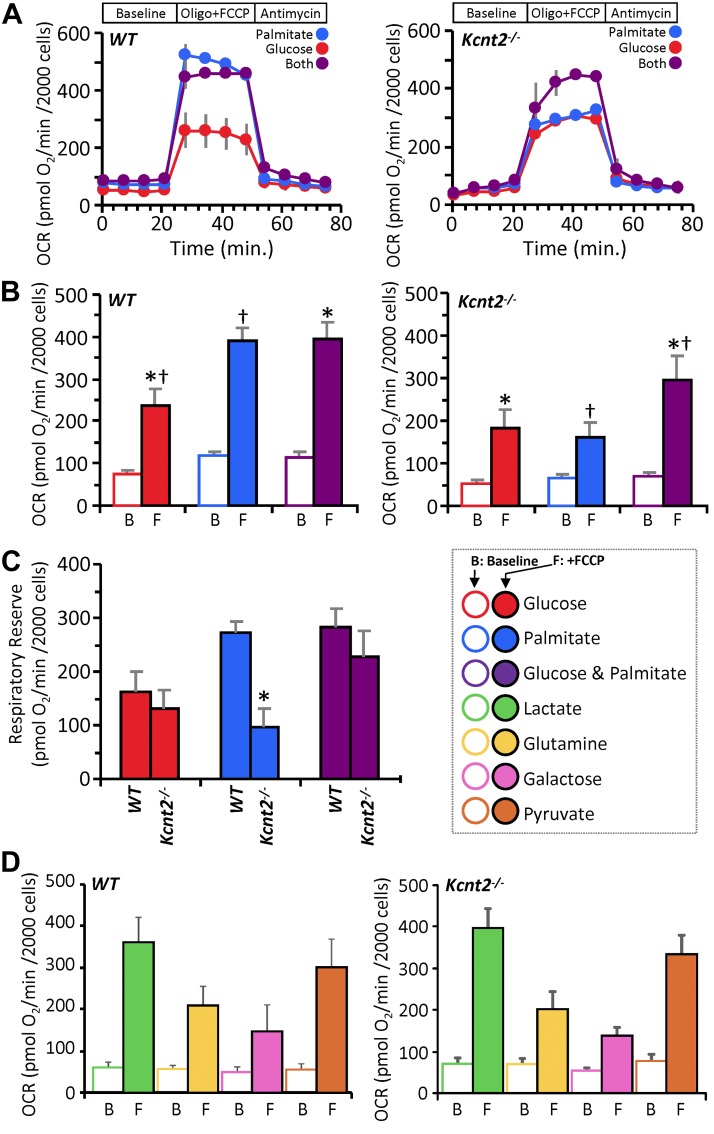
KNa1.2 loss impacts cardiac metabolic substrate choice under stress. A) Representative OCR traces of isolated WT or Kcnt2−/− cardiomyocytes, incubated in the presence of different metabolic substrates. Data from a single XF plate are shown (mean ± sd of 12 wells/substrate or genotype). Timeline above traces shows the OCR was measured at baseline, then with the addition of the ATP synthase inhibitor oligomycin (1 µg/ml) plus the mitochondrial uncoupler FCCP (500 nM), and finally with the mitochondrial complex III inhibitor antimycin A (5 µM). B) Group OCR averages of baseline (B) and FCCP-uncoupled (F) cardiomyocytes under substrate conditions as defined above. Statistics were measured using 2-way ANOVA with Bonferroni correction and post hoc Student’s t test. Data are mean ± sem, for n = 4 Kcnt2−/− or 5 WT, independent cardiomyocyte preparations. Bars with the same symbol are significantly different from one another. P < 0.05. C) RR capacity calculated from the data in B (i.e., uncoupled minus baseline OCR). Mean ± sem (n = 4–5). *P < 0.05 between genotypes. Color key for metabolic substrates used in all panels is shown to the right of C. D) OCR of WT and Kcnt2−/− cardiomyocytes metabolizing different substrates. Empty bars, baseline (B); filled bars, FCCP uncoupled (F). Data are means ± sem from 4 to 5 independent cardiomyocyte preparations.

