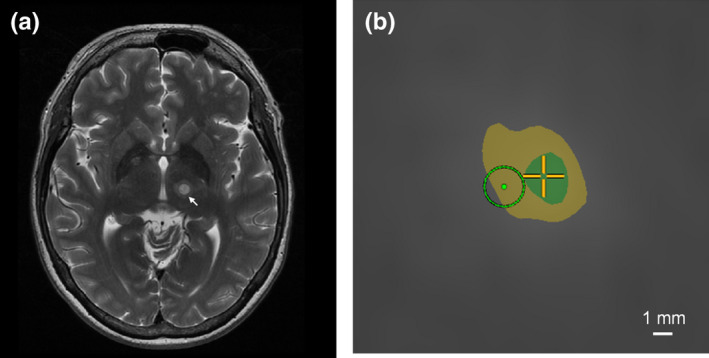
Figure 1.

(a). Axial T2‐weighted MR image acquired 1 day post‐treatment showing a lesion in the VIM nucleus (arrow); (b). Screenshot from the MRgFUS system console displaying a thermal dose calculation after a single sonication in the same patient (axial plane, zoomed in around the target). The green (inner) and yellow (outer) areas represent regions that received a thermal dose exceeding 240 and 17 CEM, respectively. The light green circle denotes the intended target zone (diameter ~2 mm). In this example, the frequency encoding direction was left‐to‐right, and an off‐resonance‐induced shift on the order of 2 mm was observed along this direction. [Color figure can be viewed at wileyonlinelibrary.com]
