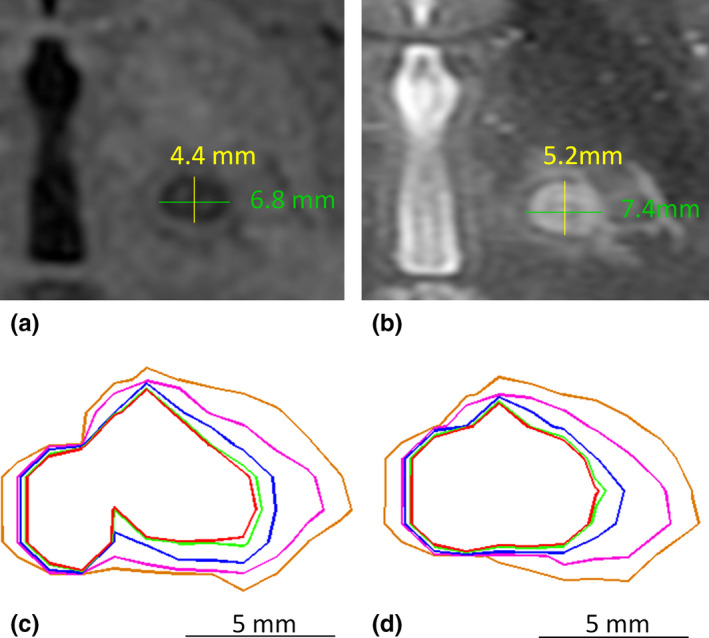
Figure 2.

Example illustrating lesion size and thermal dose measurements. (a). Lesion visualization and size measurement on axial T1‐weighted MR imaging; (b). Lesion visualization and size measurement on axial T2‐weighted MR imaging; (c). ATD without correction for off‐resonance‐induced spatial shifts; (d). ATD with correction for off‐resonance‐induced spatial shifts. The red, light green, blue, pink, and orange contours correspond to regions that received over 240, 200, 100, 40, and 17 CEM, respectively. Nine sonications were used in this calculation, among which six were monitored in axial and three in coronal. [Color figure can be viewed at wileyonlinelibrary.com]
