
Figure 3.
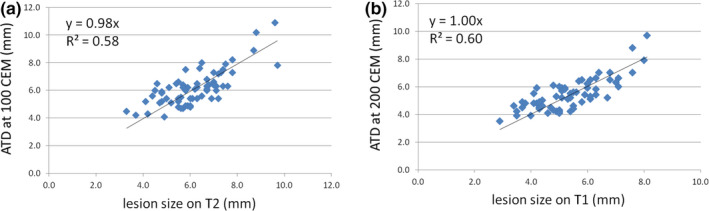
(a). Linear regression between the lesion size measured on T2‐weighted MRI 1 day post‐treatment and the size of the ATD profile at 100 CEM; (b). Linear regression between the lesion size measured on T1‐weighted MRI 1 day post‐treatment and the size of the ATD profile at 200 CEM. The regression slopes were close to unity, indicating a good correlation in both cases. [Color figure can be viewed at wileyonlinelibrary.com]