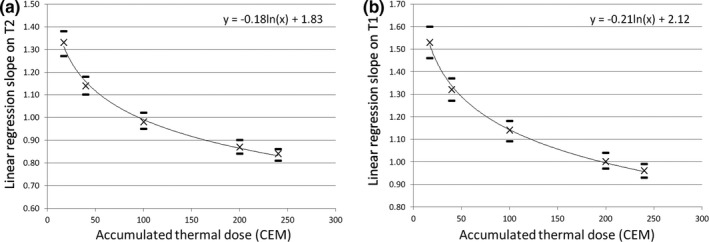
Figure 4.

Slopes of linear regressions between the lesion size measured via (a) T2‐ and (b) T1‐weighted MRI 1 day post‐treatment and the ATD profile size for 17, 40, 100, 200, and 240 CEM. Error bars show the range of slope estimates at 95% confidence intervals. Logarithmic regressions showed that the best estimation of the lesion size (i.e. linear regression slope = 1) on T2‐ and T1‐weighted MRI was found using an ATD of 100 and 200 CEM, respectively.
