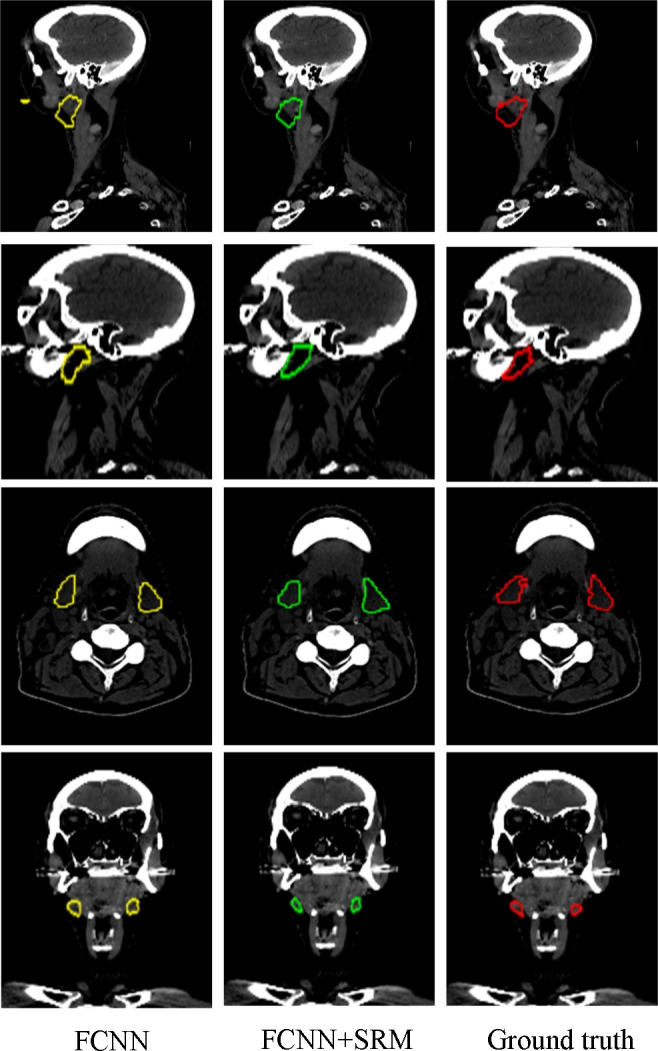
Figure 5.

Visual comparison of segmentation results of the parotid glands (the first and second rows) and submandibular glands (the third and fourth rows) using our method with and without SRM. The three columns show the segmentation results and ground truth overlaid on the CT. Yellow and green denote the FCNN segmentations with and without SRM respectively. The red contours denote the ground truth. [Color figure can be viewed at wileyonlinelibrary.com]
