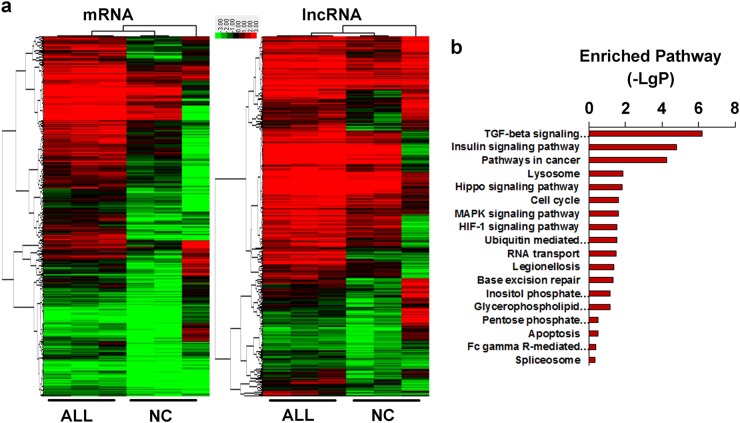
Fig. 1. The expression profiling of transcriptome in T cells from pediatric T-ALL and healthy controls.
a The different expressed lncRNA and mRNA was clustered by using hierarchical clustering analysis with the cut-off 4/0.25 and false discovery rate < 0.05 in T cells extracted bone marrow from paediatric T-ALL (labeled as ALL) and healthy controls(labeled as NC). CD3 beads was used for sorting the T cells after culturing for 3 day with IL-2 supplied. The green/red color bar indicated the relative expression level of mRNA/lncRNA presented by log-transformed. b Pathway enrichment was conducted by using different database. P < 0.05 was used as cutoff with log-transformed

