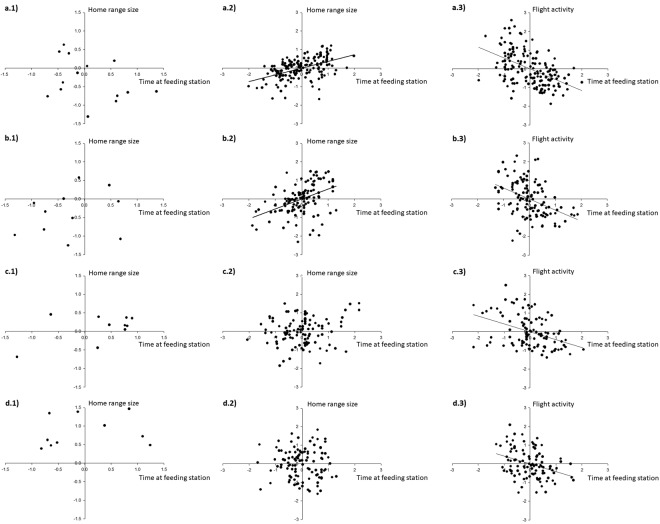
Figure 2.
Within- and among-individual correlations between mobility parameters (home range size and flight activity) and time spent at the central feeding station in Egyptian vultures for (a) territorial females, (b) territorial males, (c) non-territorial females and, (d) non-territorial males, tracked between October 2015 and September 2016. (a.1–d.1) among-individual correlations (n = 45 individual means), (a.2–d.2,a.3–d.3) within-individual correlation (n = 486 months). The plot of the among-individual correlation is visualized as the correlation between means of each individual trait; the within-individual correlation is visualized as the correlation between the deviations of each monthly observation from a focal individual’s mean for each trait.

