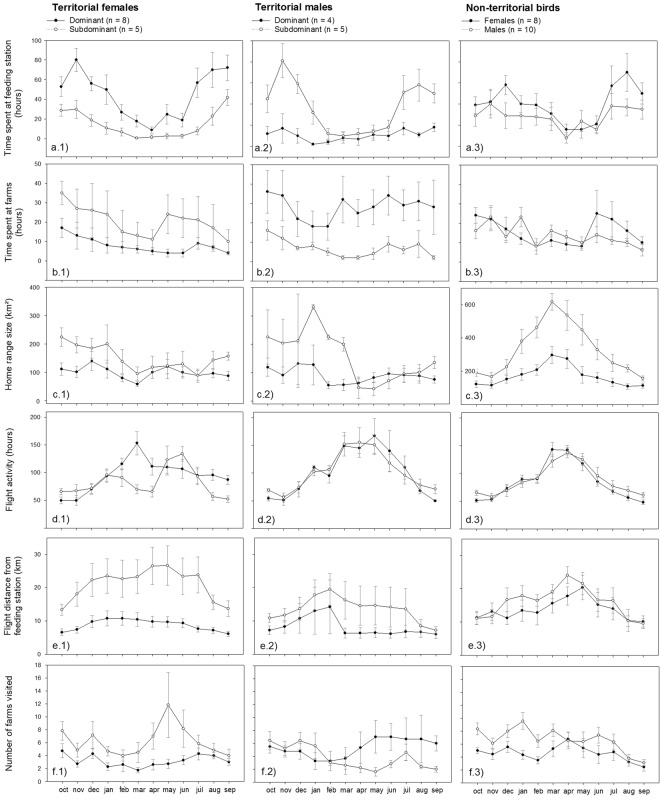
Figure 4.
Overview of monthly variation in (a) time spent at the central feeding station and (b) farms (all pooled), (c) home range size (95% Kernel Density Estimate (KDE)), (d) flight activity (number of hours flying), (e) flight distance from the central feeding station, and (f) the total number of farms visited. Data for territorial and non-territorial male and female Egyptian vultures tracked with GPS-loggers on Fuerteventura between October 2015 and September 2016. For illustrative purposes, territorial males and females were categorized according to dominance status (dominant above and subdominant below the median), but included as a continuous variable in statistical models. In non-territorial males and females no effects of dominance was present. Note that the breeding activities of vultures occur between January and July (with the peak in egg-laying occurring in March).

