Figure 1.
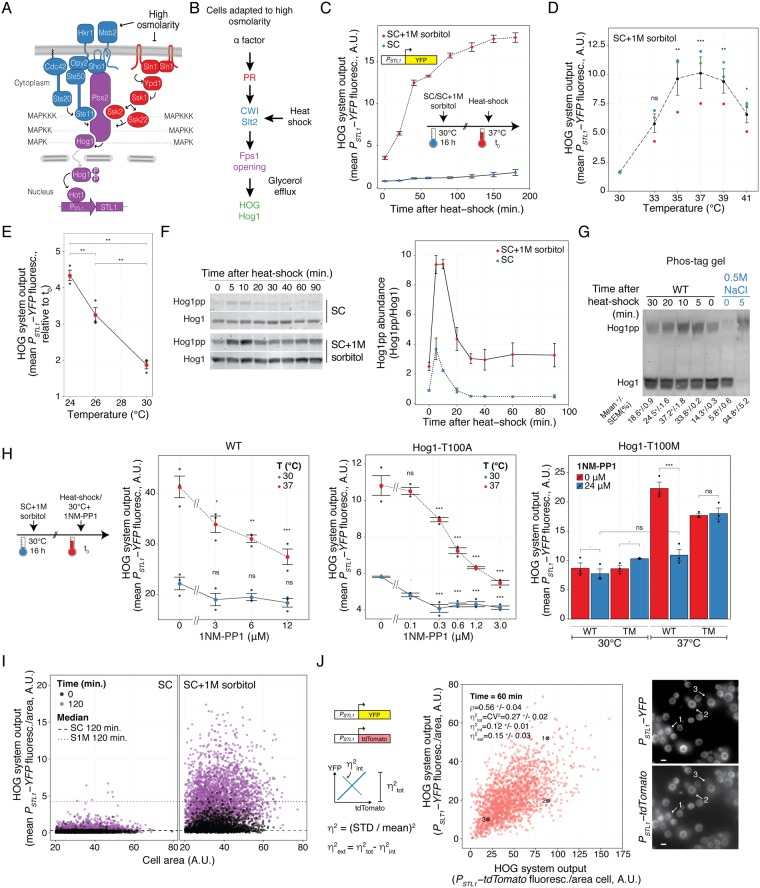
Heat-shock stimulates the HOG pathway. (A) The HOG pathway with its two branches (Sho1 in blue and Sln1 in red) converge on Pbs2, which phosphorylates and thus activates the MAPK Hog1. Active Hog1 translocates to the nucleus where it induces gene expression via the transcription factors Sko1, Skp1 (not shown), and Hot1. (B) Mating pheromone stimulates HOG indirectly. α factor activates the Cell Wall Integrity pathway, which in turn causes loss of glycerol through the aqua glyceroporin Fps1, leading to reduced turgor, and causing HOG activation. We hypothesize that heat-shock (HS) stimulates HOG via this route as well. This activating pathway is amplified in cells adapted to high osmolarity medium. (C) HOG transcriptional reporter dynamics following a shift from 30 °C to 37 °C in cells grown in SC or SC + 1M sorbitol. Plot shows HOG system output (population average of the total YFP accumulated in each cell) vs. time. (D) HOG system output of cells grown in SC + 1M sorbitol after 1 h of temperature shift from 30 °C to the indicated temperatures. (E) HOG activation by temperature shifts from the indicated temperatures to 37 °C in cells adapted to SC + 1M sorbitol. Plot shows HOG system output after 2 h of temperature shift. Colors correspond to replicate experiments. (F) HOG MAPK activation dynamics following a shift from 30 °C to 37 °C. Hog1 phosphorylation was assayed by immunoblotting. Left. Representative blot. Right. Plot of Hog1pp abundance. Uncropped blot in Fig. S3. (G) Same as in F but extracts were run in phos-tag polyacrylamide gels. We include a control of an extract from yeast grown in SC 5 minutes after addition of 0.5 M NaCl. Top. Representative blot. Bottom. Quantification showing fraction of phosphorylated Hog1 ± SEM. Uncropped blot in Fig. S4. (H) HOG system output in strains expressing WT Hog1, Hog1-T100A or Hog1-T100M mutants was measured after 2 h of temperature shift in the presence of the indicated concentration of 1NM-PP1. Statistical comparisons of left and middle plots are against the 0 μM 1NM-PP1 at the corresponding temperate. (I) Scatter plot comparing data at 0 vs. 120 minutes after temperature shift of cells grown in SC or SC + 1 M sorbitol. Plot shows HOG system output/area vs. area of individual cells. (J) Cell-to-cell variability in HOG activation. A strain with two identical STL1 promoters driving YFP or tdTomato grown in 1 M sorbitol medium after 1 h shift from 30 °C to 37 °C. Plot shows YFP vs. tdTomato protein reporters. ρ indicates Pearson correlation coefficient. Total variability is measured using η2tot (STD2(xFP/<xFP>)); intrinsic noise η2int (0.5 x STD2(YFP/<YFP> - tdTomato/<tdTomato>)) and η2ext (η2tot - η2int) (see Methods). Images show a representative field. Numbers mark selected cells from the plot. White bar corresponds to 5 μm. Strains: LD3342, RB3937, RB3938 and YGB5938. In panels C, D, E, F, G and H data correspond to the mean of three independent replicates (shown as dots) ± SEM.

