Figure 1.
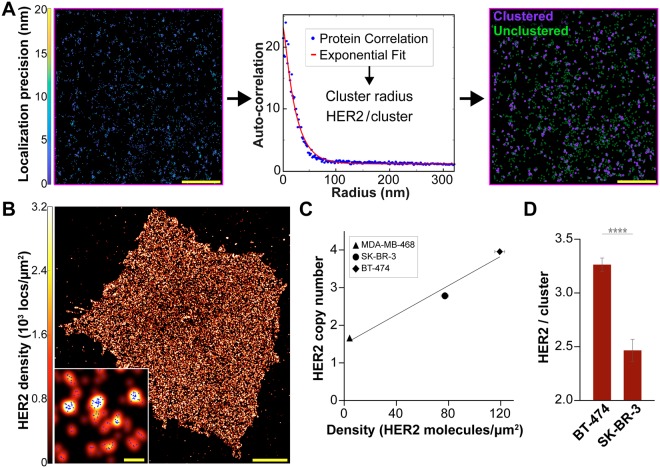
HER2 molecular features in breast cancer cell lines. BT-474, SK-BR-3, and MDA-MB-468 cells were fixed, stained with 50 nM trastuzumab-AF647, and imaged with dSTORM. (A) Outline of qSMLM approach with a representative 20 µm2 ROI from a BT-474 cell (scale bar: 1 µm). In the right panel, purple and green circles represent clustered (more than 2 HER2 molecules residing in cluster) and unclustered HER2, respectively. (B) BT-474 cell with individual localizations (blue) rendered by a Gaussian blur. The intensity of the Gaussian blur is proportional to the localization density. Scale bar: 5 μm. A zoomed-in region is provided as an inset (scale bar: 100 nm). (C) Average detected HER2 density from qSMLM versus HER2 copy number from FISH. Copy number values were taken from the Cancer Cell Line Encyclopedia – Broad Institute33,34. The following number of ROIs were used for analysis: MDA-MB-468 (19 cells, 37 ROIs), SK-BR-3 (17 cells, 163 ROIs), and BT-474 (23 cells, 180 ROIs). The best-fit line has R2 = 0.96. (D) Average number of HER2 receptors per cluster for BT-474 and SK-BR-3 cells calculated by PC analysis. Clustered regions were used for analysis (53 ROIs for BT-474 and 31 ROIs for SK-BR-3); ****p < 0.0001. All error bars represent SEM. Additional statistical considerations are included in Supplementary Table 1.

