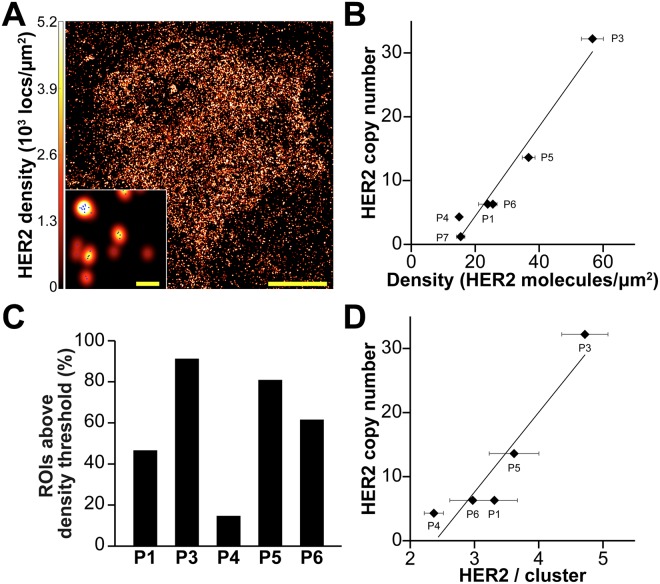
Figure 4.
qSMLM results corroborate FISH analysis. (A) A touch prep region with individual localizations (blue) rendered by a Gaussian blur. The intensity of the Gaussian blur is proportional to the localization density (full cell, scale bar: 5 μm; zoomed-in region, scale bar: 100 nm). (B) Average detected HER2 density from qSMLM versus HER2 copy number from FISH. The following number of ROIs were used for analysis: P1 (30 ROIs), P3 (92 ROIs), P4 (88 ROIs), P5 (131 ROIs), P6 (164 ROIs), P7 (46 ROIs). Complete FISH data was not available for P2. The fitted least-square line has a slope estimate of 0.70, and an intercept estimate of −9.63 (R2 = 0.958). (C) Fraction of ROIs above HER2 density threshold. (D) The average HER2 receptors per cluster versus HER2 copy number from FISH. Clustered regions were used for analysis (19 ROI for P1, 44 ROI for P3, 28 ROI for P4, 10 ROI for P5, and 14 ROI for P6). The fitted least-square line has a slope estimate of 12.45, and an intercept estimate of −29.75 (R2 = 0.88). Error bars are SEM. Additional statistical considerations are included in Table 1.

