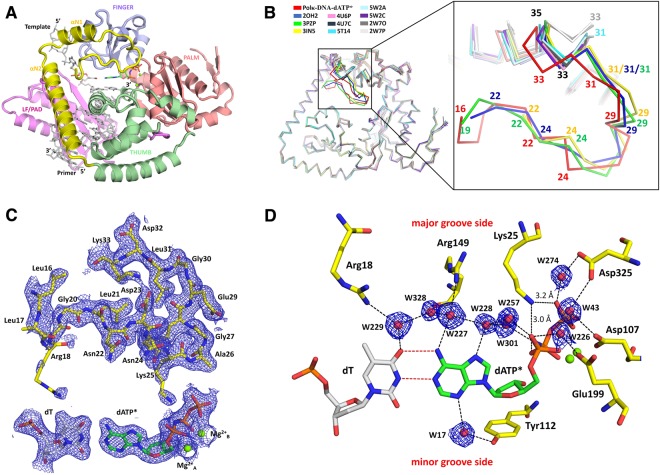
Figure 1.
Structure of human Y-family polymerase kappa. (A) Cartoon diagram representing the overall structure of the ternary complex. The palm, fingers, thumb and LF/PAD domains are shown in pink, light blue, green, and magenta, respectively. The N-clasp subdomain, unique to polκ, is highlighted in yellow. DNA is represented as grey sticks, Mg2+ ions are shown as green spheres, and the incoming nucleotide is shown as multicolored green sticks. (B) Superposition of all polκ-DNA ternary complex structures showing the region of disorder in the N-terminal loop of the N-clasp. All available polκ complex structures were superposed based on their palm domains. On the left is the overall comparison of the structures. The largest deviation is observed between residues 16–35, which is highlighted in dark colors and is zoomed in on the right. The PDB IDs of the structures used for superposition are polκ-DNA-dATP* in the present study (red); 5W2A (light cyan); 5W2C (light orange); 5T14 (cyan); 4U6P (dark pink); 4U7C (light pink); 2OH2 (blue); 3PZP (green); 3IN5 (yellow); 2W7O (dark grey); and 2W7P (light grey). (C) 2Fo-Fc electron density map of the N-terminal residues, template dT, incoming dATP*, and two putative Mg2+ ions contoured at 1.0σ level. Residues are highlighted and labeled. (D) A close-up view of the polκ active-site region. 2Fo-Fc electron density map contoured at 1.0σ is shown for the water molecules engaged in the hydrogen-bond network with the residues and the incoming nucleotide.

