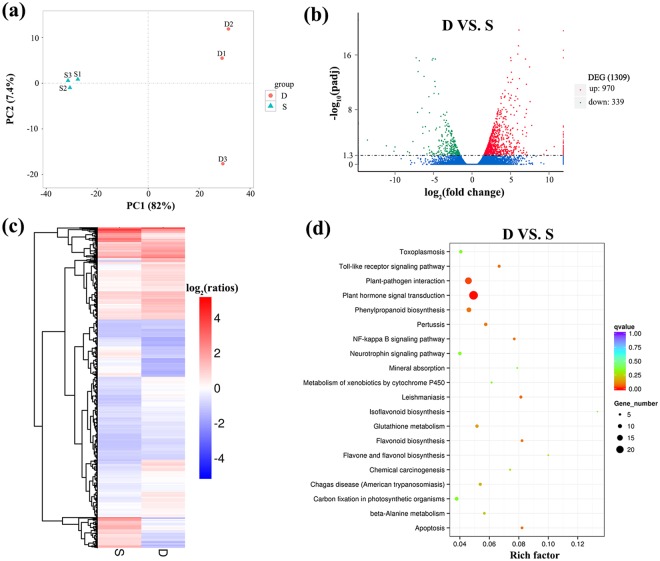
Figure 4.
Analysis of differentially expressed genes (DEGs) in dwarf and non-dwarf progenies. (a) Principle component analysis (PCA) of the RNA-seq datasets. The blue triangles indicate the non-dwarf samples and the red circles indicate the dwarf samples. (b) Volcano plot of gene differential analysis of dwarf vs. non-dwarf (D VS. S). Filter of differential genes is padj <0.05. Every plot represents a gene. The blue circles indicate genes without significant difference, the red circles indicate up-regulated genes and the green circles indicate down-regulated genes. (c) Overall cluster analysis of DEGs in the transcriptomic comparisons of D vs. S. FPKM was used to estimate the level of gene expression. The color that changes from red (highly expressed) to blue (low expression) represents the relative expression level value log2 (ratios). (d) Top 20 KEGG pathway enrichment of up- and down-regulated DEGs. The number of genes in each pathway is equal to the dot size. The dot color represents the q-value. The smaller the q-value, the redder the dot. Rich factor = number of DEGs enriched in certain pathway term/ number of unigenes annotated in this pathway term. All up- and down-regulated DEGs are listed in detail in Supplementary Table S10.

