
Figure 3.
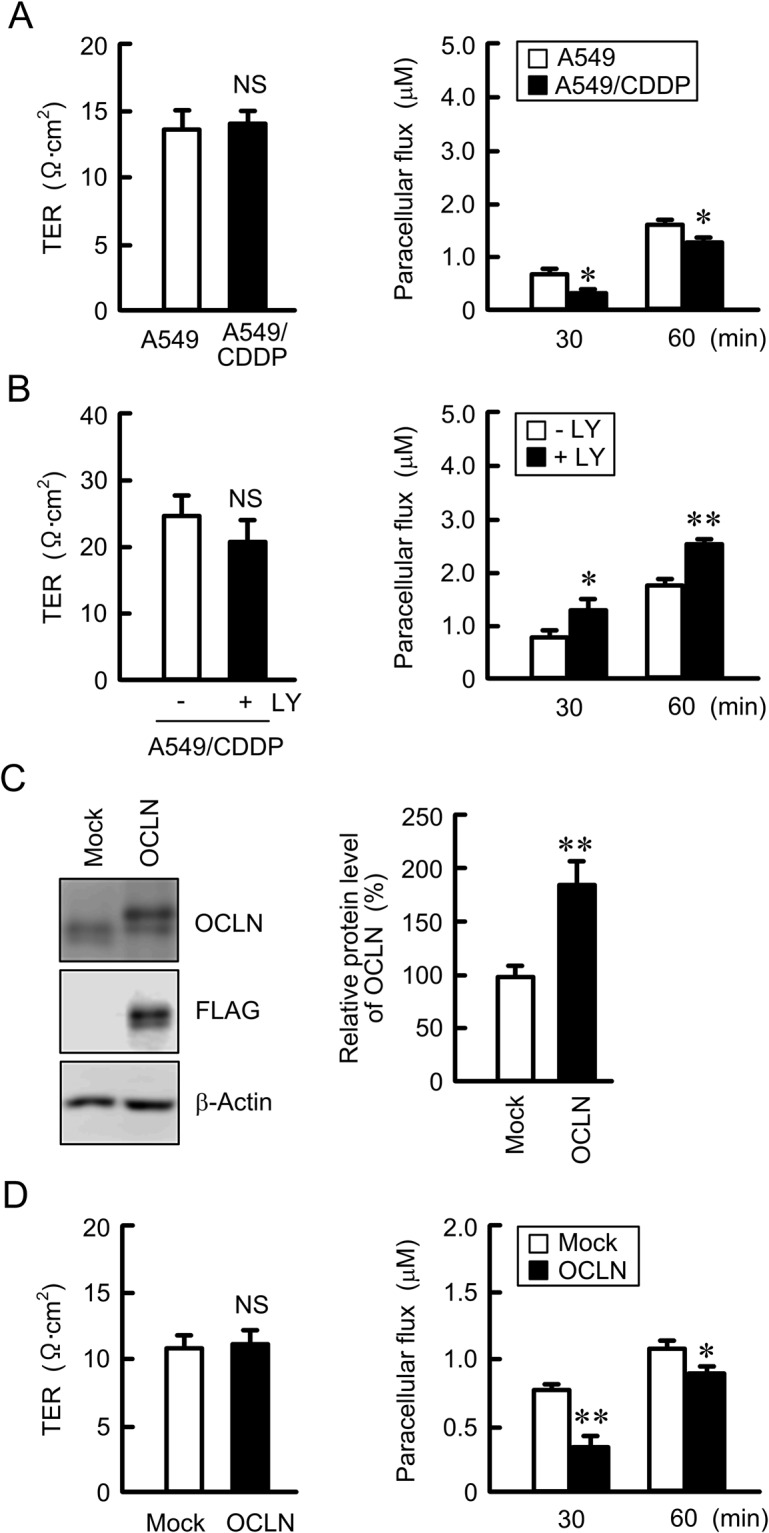
Effect of OCLN expression on tight junction permeability. (A and B) A549 and A549/CDDP cells were plated on transwell inserts. As indicated, A549/CDDP cells were treated with or without of 10 μM LY-294002 (LY) for 24 h. TER and paracellular DXR flux were analyzed by a volt ohmmeter and fluorescence spectrometry, respectively. (C) Cell lysates were prepared from empty (mock) or FLAG-tagged OCLN-expressing cells. The expression of OCLN, FLAG, and β-actin was examined by western blotting. The protein levels of OCLN are shown as a percentage of the values in mock cells. The full-length blot images are shown in Supplementary Fig. S3. (D) TER and the paracellular DXR flux were measured in mock and OCLN-expressing cells. n = 3–4. **P < 0.01 and *P < 0.05 compared with A549. NS, P > 0.05.