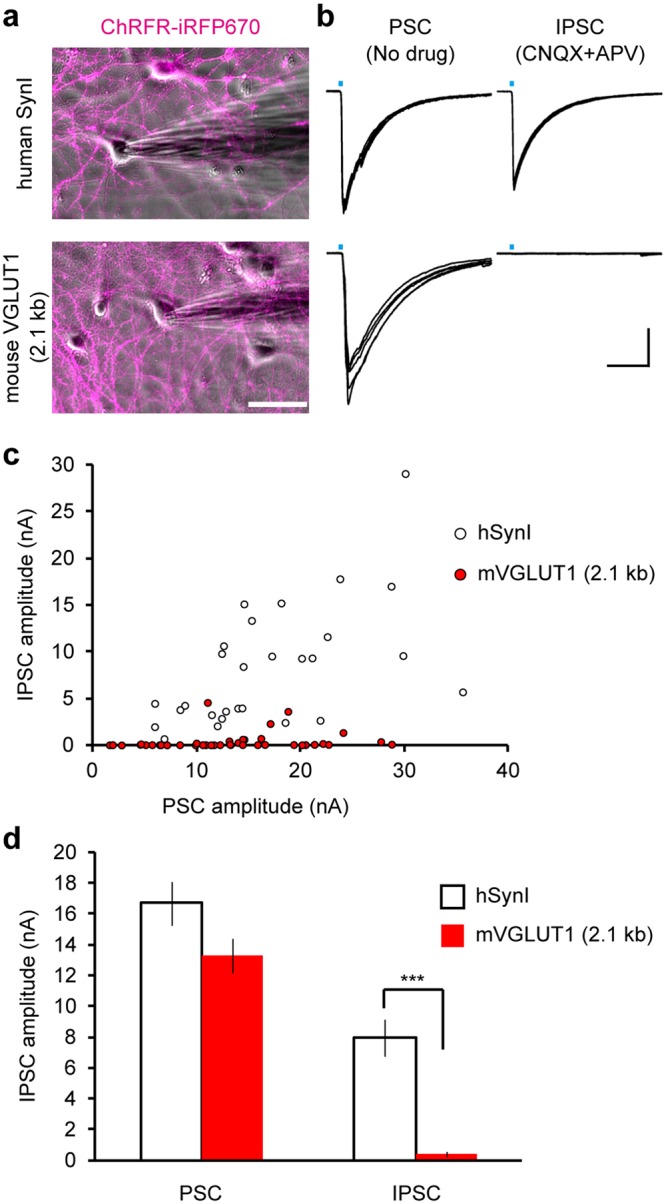
Figure 6.

Optogenetic stimulation of cultured neurons transduced by the synapsin I promoter and the VGLUT1 promoter. (a) Fluorescence images of ChRFR-iRFP670 (magenta) overlaid on phase contrast images of the cultures transduced with lentiviral vectors equipped with the synapsin I promoter (upper panel) and the VGLUT1 promoter (lower panel). Patch clamp recordings were performed from ChRFR-negative neurons. Scale bar indicates 50 μm. (b) Representative traces of light-evoked currents recorded from the neuron shown in (a) in the absence of a postsynaptic receptor inhibitor (PSC, right) and in the presence of ionotropic glutamate receptor antagonists, CNQX and APV (IPSC, left). Five consecutive traces are overlaid. Light pulses of ~10 ms duration (blue bars) were applied through a 470 nm bandpass filter with an 11 nm bandwidth. Horizontal and vertical scale bars indicate 50 ms and 4 nA, respectively. (c) Summary plots displaying the amplitudes of the PSCs and the IPSCs recorded from the cultures that were transduced with lentiviral vectors equipped with the synapsin I promoter (white, n = 29 cells) and the VGLUT1 promoter (red, n = 40 cells). (d) The average amplitude of the PSCs and the IPSCs shown in (c). The IPSCs were almost entirely suppressed when the VGLUT1 promoter was used (***p < 0.001, unpaired t-test), while the PSCs recorded from the two groups were not significantly different (p = 0.06, unpaired t-test).
