
Figure 2.
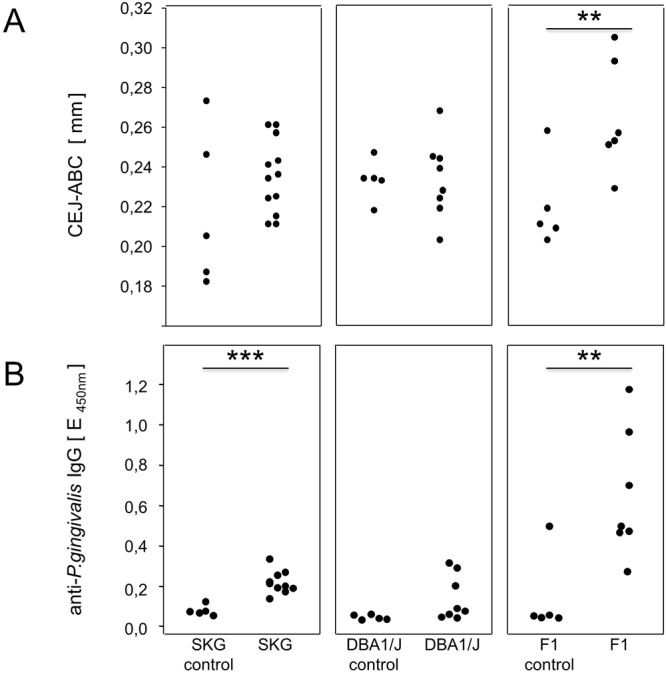
DBA/1J × B10.Q F1 mice were most susceptible to P. gingivalis (Pg) induced PD and anti-Pg antibody response. (A) Depicts the alveolar bone loss after PD induction by presenting the distance from the cementoenemal junction to the alveolar bone crest (CEJ-ABC) in millimeters of each individual mouse that was orally inoculated and their control mates. Assessment was performed by µCT. (B) Shows the anti-P. gingivalis antibody titers comparing again individual mice that were orally inoculated to their untreated controls. Numbers of mice per group were SKG N = 10, DBA/1J N = 8, F1 (DBA/1J × B10.Q) N = 7, controls were N = 5 for each strain.