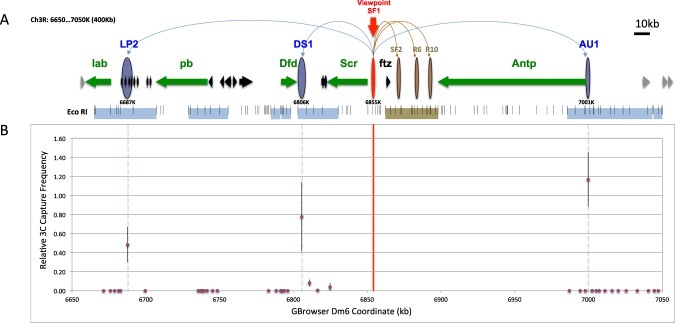
Figure 1.
Chromosome Conformation Capture (3C) identification of novel SF1-Tethering-Elements (STEs) in ANT-C. (A) Diagram of ANT-C. Map coordinate is based on the Drosophila genome browser dm6 (BDGP R6 Plus ISO1 MT)92. Horizontal arrows indicate genes and their transcription direction. Green arrows represent homeotic genes; black and gray arrows represent non-homeotic genes within and outside of ANT-C, respectively. The horizontal bars below genes represent regions tested in the SF1-based 3C captures in the current study (light blue) and a previous study (brown)22. Small vertical lines represent EcoR I sites. Vertical ovals indicate SF1 (red) and STEs identified in the current study (blue) and those from previous work (brown)22. Gbrowser coordinates for the center of the captured fragment is labeled underneath the blue oval. Long curves on top represent looping interactions between SF1 and STEs. (B) Relative SF1-capture frequency of 39 EcoR I fragments in the ANT-C intergenic regions. The coordinates at the center of each fragment is plotted against the average capture frequency over control (for detail see methods)22. Red vertical line represents the position of SF1 and blue dashed lines represent the positions of STEs.

