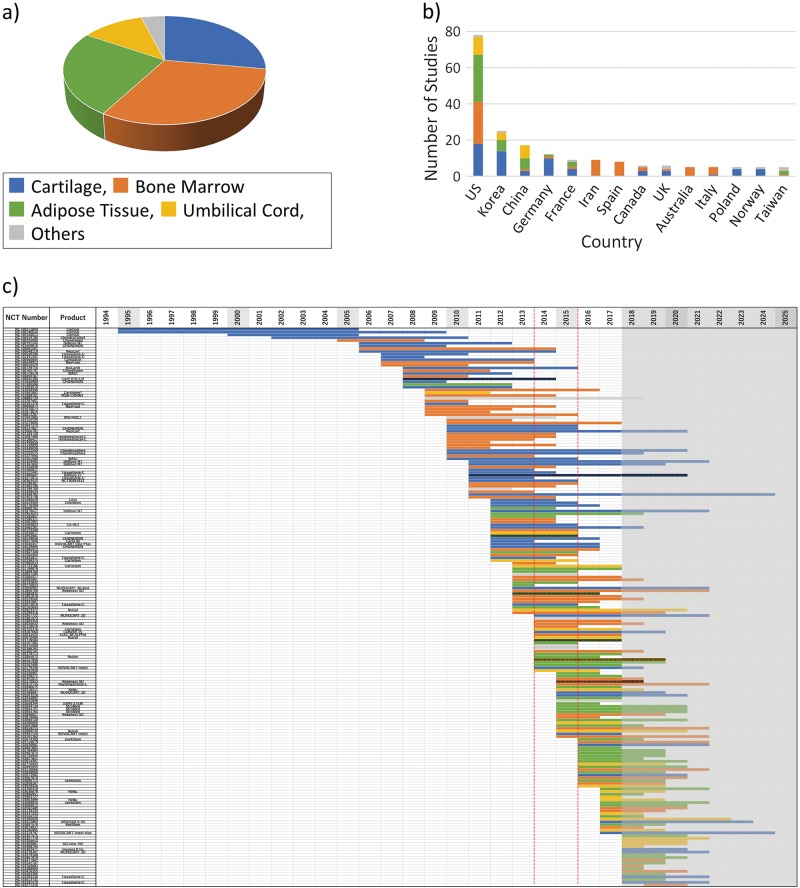
Fig. 1.
Analysis of projects in ClinicalTrials.gov according to the cell source organ used for cell therapy and cartilage repair. “Others” include studies that are using multiple cell sources for combination or comparison. a Percentage of each cell source relative to the total number of studies. b Comparison of number of clinical trials on cartilage repair according to countries of origin. Each color-coded part of the bar depicts the corresponding cell-source organ by country. The top 12 countries are shown in this graph. c Each study was color-coded by the corresponding cell source organ and displayed from the start year to the (planned) completion year, sorted by start year in chronological order. Shaded column: current year (2018) to 2025. Since 2018, a trial bar displays if the trial is registered. Please note that we could not show if the trial continued or was halted prematurely. Red-dashed column: 2014–15. Vertical-striped bar indicates “suspended,” “terminated,” or “withdrawn” study

