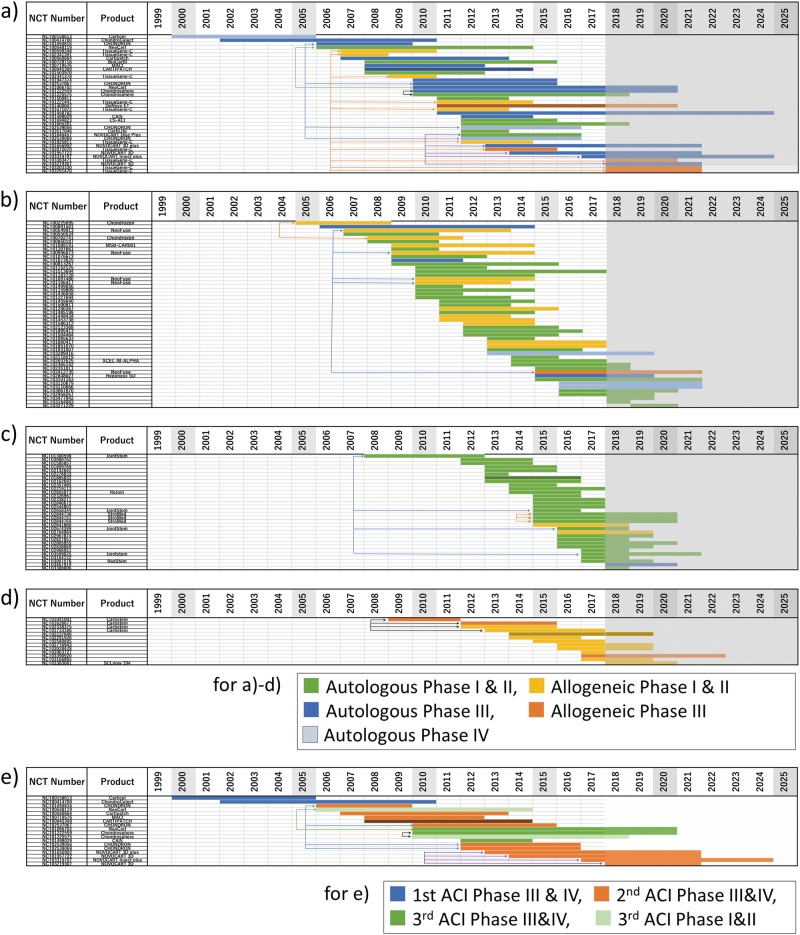
Fig. 3.
Chronological display (sorted by start year) of cartilage repair trials in which a cartilage, b bone marrow, c adipose tissue, or d umbilical cord7 was used as the cell source. Each study was plotted from start year to completion year as a color-coded bar showing the origin of the cell source (autologous or allogeneic) and the corresponding clinical stage, as shown in examples in the frame below d. For convenience, trackable products with multiple trials were linked with colored lines and arrows as follows; a blue: Chondron, green: NeoCart, yellow: TissueGene-C, black: Chondrosphere, and purple: Novocart; b blue: NeoFuse and yellow: Chondrogen; c blue: JointStem and yellow: StroMed; d black: CARTISTEM. e Chronological display (sorted by start year) of the clinical trials of each generation of ACI products. Each study was plotted from the start to the completion year as a color-coded bar, which indicates the generation of ACI and corresponding clinical phases, as shown in examples in the frame below e. We could not find any phase I and II studies corresponding to the first ACI in ClinicalTrials.gov. Shaded column: current year (2018) to 2025. Since 2018, a trial bar displays if the trial is registered. Please note that we could not show if the trial continued or was halted prematurely. Vertical-striped bar indicates “suspended,” “terminated,” or “withdrawn” study

