
Figure 2.
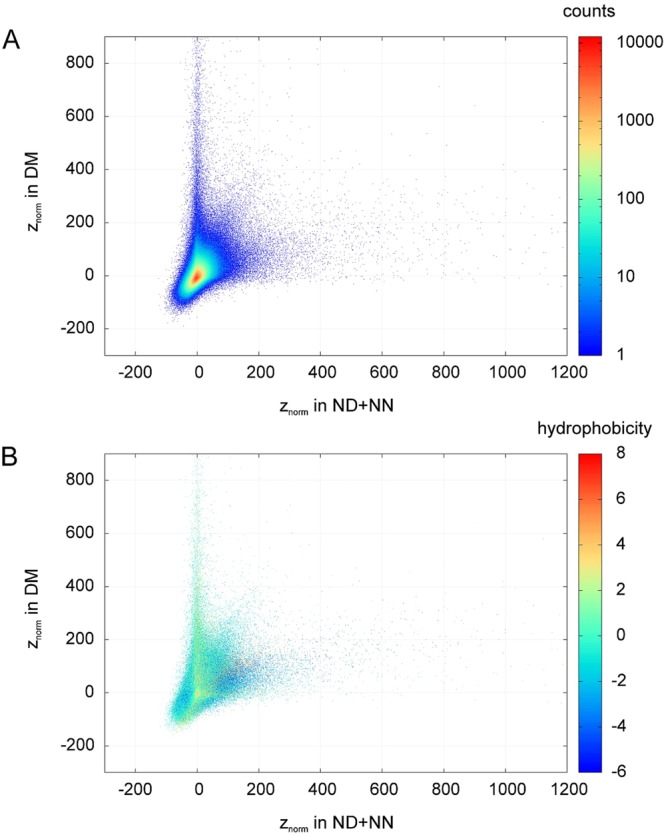
Comparison of z-scores expressing the observed numbers of occurrences of pentapeptides in relation to the expected numbers of occurrences (see Methods, “Analysis of pentapeptide abundances using permutation groups and z-scores” section) for domain (DM) and non-domain (ND + NN) regions. The znorm notation points out that normal distribution is assumed. Every point represents a pentapeptide. Colouring by abundance (A) or by hydrophobicity scale (B)33. Arithmetic average is taken when two points overlap. In Fig. 2A, red means many overlapping pentapeptides, blue - single pentapeptides.