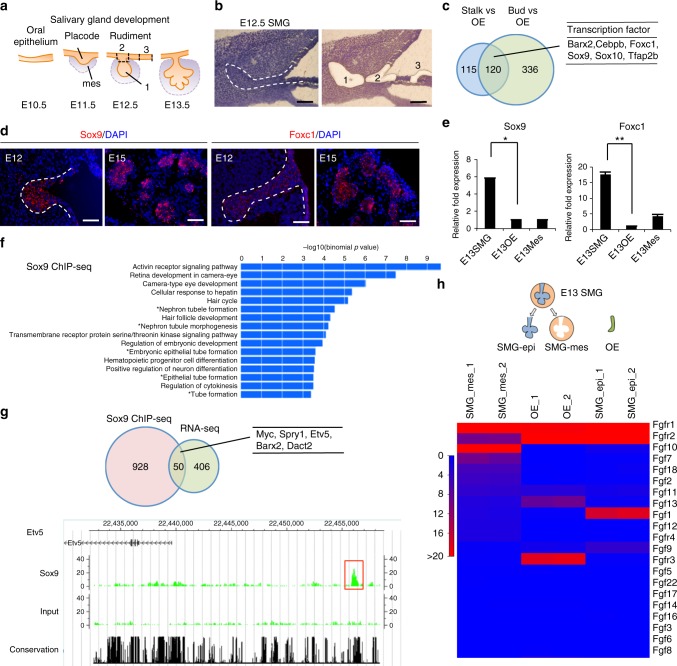
Fig. 1.
Identification of essential factors related to salivary gland development. a Schematic representation of salivary gland development. b Representative images of submandibular gland (SMG) bud (1), SMG stalk (2), and oral epithelium (OE) distant from SMG (3) before and after laser micro-dissection. The white dashed line indicates SMG epithelium. Scale bars, 50 μm. c Venn diagram illustrating the overlapping genes between the genes up-regulated in stalk and bud compared with OE. Up-regulated genes were selected by identifying genes showing fold changes greater than 2.0 and RPKM values higher than 5.0 in stalk and bud. List of common up-regulated transcription factors in stalk and bud. d Sox9 and Foxc1 gene expressions were detected in E12.5 and E15.5 SMG by single-copy RNA FISH. The white dashed lines indicate SMG epithelium. Representative images from one out of three embryos are shown. Scale bars, 50 μm e Real-time RT-PCR analysis of Sox9 and Foxc1 in the SMG epithelium (SMG-epi), SMG mesenchyme (SMG-mes), and oral epithelium (OE) distant from SMG at E13.5. The results are presented as the mean ± S.D. of triplicate samples and were normalized to GAPDH. Statistical analyses were performed using Student’s t-test; *P = 0.0003, **P = 0.00007. This experiment was replicated three times with similar results. f GREAT gene ontology (GO) analysis of Sox9 ChIP-seq results from E13.5 SMGs. g Venn diagram illustrating the overlap between the up-regulated genes in E12.5 SMG bud compared with OE in RNA-seq analysis and the neighbor genes of the Sox9 peaks identified from Sox9 ChIP-seq analysis (left). List of overlapping genes involved in salivary gland development (right). CisGenome browser view of Sox9 peaks (red square outline) around the Etv5 region is also shown. Sox9 ChIP-seq (top), an input control (middle), and a conserved region (bottom). The highlighted red box indicates a Sox9 peak region. h RNA-seq analysis of the epithelium and mesenchyme of the E13.5 SMG and the OE. Heat map depicting the expression data. Only FGF signalling-related genes are listed in this heat map

