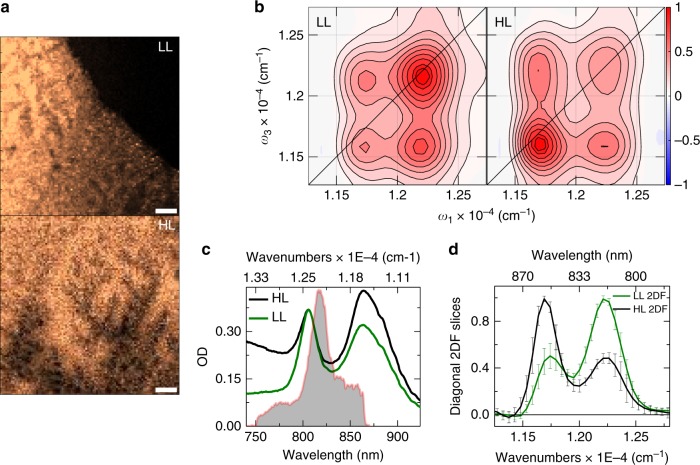
Fig. 2.
SF-2DESon unmixed cells of Rps. palustris grown under high and low light (HL and LL). a Confocal fluorescence images of a drop-dried film of photosynthetic bacteria Rps. palustris. The bacteria were grown under LL (top panel), and HL (bottom panel) conditions. A 10 μm scale bar is shown for reference. The OD of the live cell solution from which the samples were prepared is shown in panel (c) and the drop volume was measured to be ~0.08 μL through gravimetric analysis (Supplementary Note 3, Supplementary Figure 7). b Absorptive 2D spectra at t2 = 0 fs obtained by averaging 2D spectra from 5 different XY locations on the LL and HL fluorescence images, as shown in the left and right panels, respectively. The spectra show distinct cross-peaks at t2 = 0 fs. The LL and HL 2D spectra are normalized relative to the B800 and B850 bands, respectively, to more clearly emphasize their spectral differences. Contours are drawn at 10–90% in steps of 10%, with additional contours at 95 and 100% to highlight small differences in maxima. The frequency ω corresponding to the axes labels on the 2D plots corresponds to ω = |ω′|/2πc, where ω′ is in rad/fs. c Linear absorption spectrum for LL and HL grown Rps. palustris overlaid with the laser spectrum (gray area). The OD for the LL sample is scaled by a factor of 0.37 such both samples have the same OD at the B800 band. Note that the LL and HL cell concentrations are different. d Slices through the maxima of the upper and lower diagonal peaks of the LL and HL 2D spectra shown in panel b. The error bars are obtained from averaging LL and HL 2D spectra at 5 different locations on the fluorescence images of panel a. The solid black line across the 2D plot corresponds to the diagonal. All measurements were conducted at 300 K

