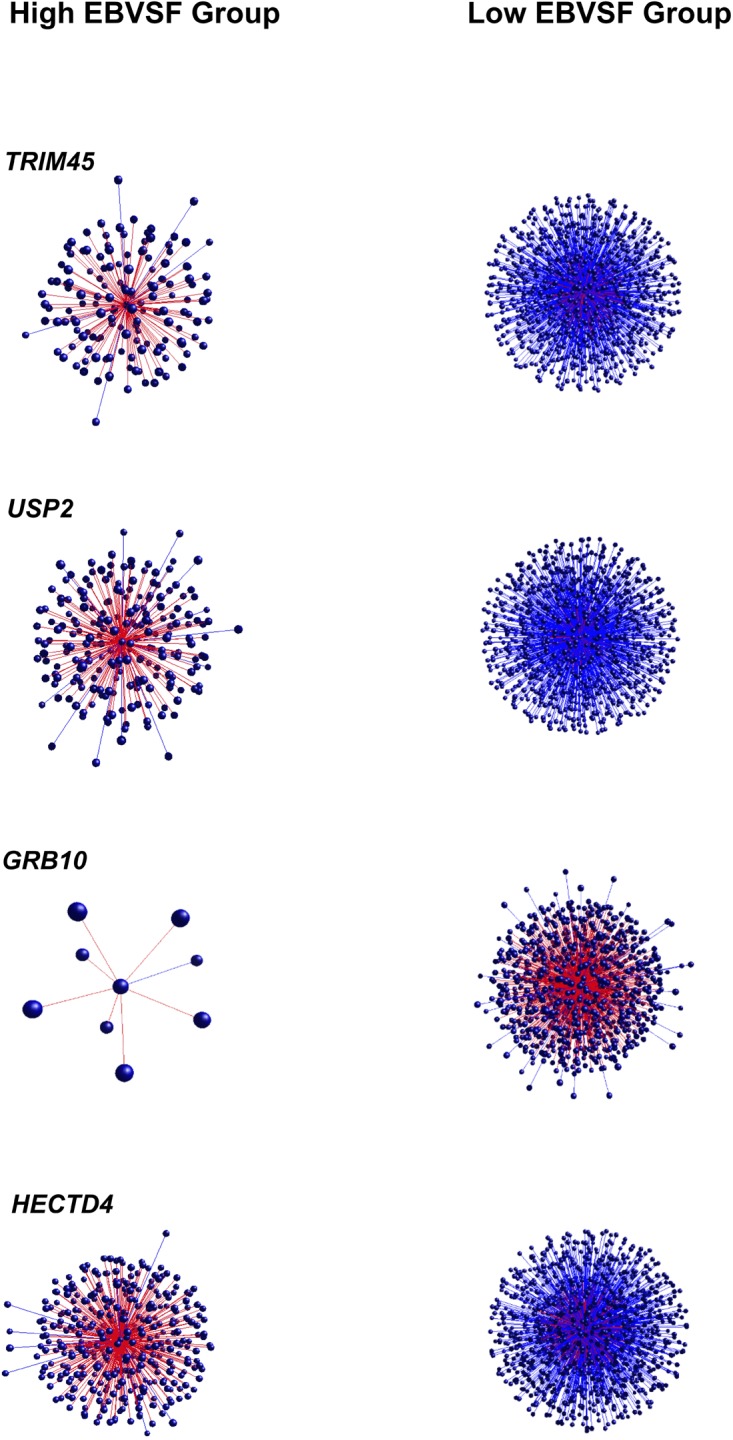
FIGURE 1.

Negative DH between the H and L groups for EBVSF at 14 days of aging. The center spot represents a hub transcript with a high value of DH, red lines represent positive DH and blue lines represent negative DH. All lines represent significant partial correlations ≥ 0.90 at p-value < 0.05 based on the information theory approach, which accounts for all comparisons in the analysis.
