
FIGURE 2.
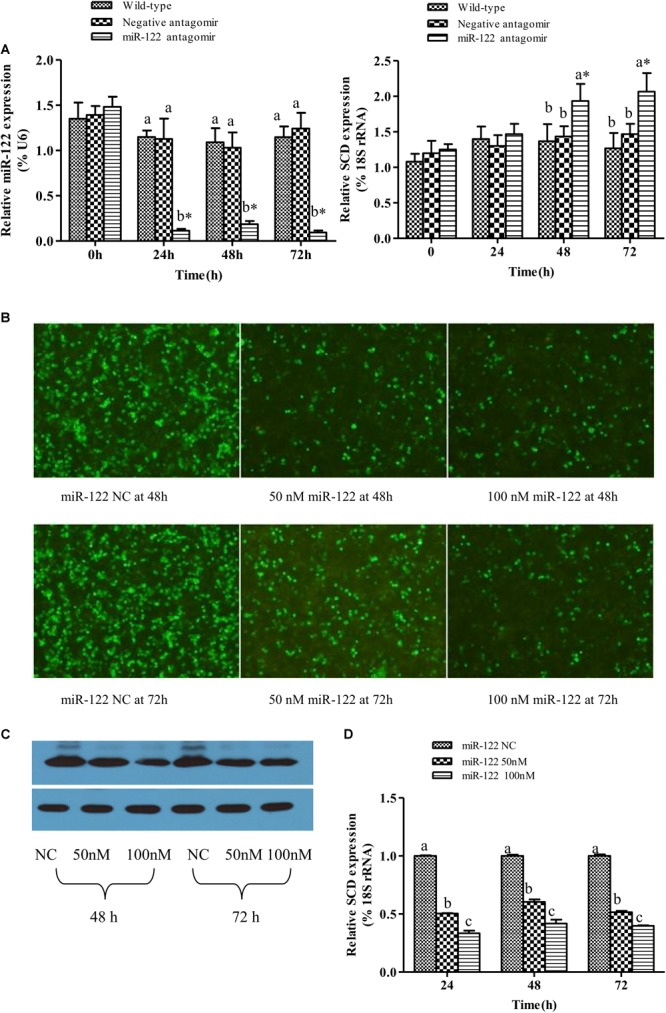
Analysis of regulatory relationships between miR-122 and SCD. (A) Juvenile GIFT weighing about 10 g were injected in tail vein with PBS, miR-122 negative control, or miR-122 antagomir (dose, 50 mg kg-1 body weight). Transcript levels of SCD and miR-122 in GIFT liver were determined by qRT-PCR for 72 h. GIFT injected with PBS served as control. (B) Verification of regulatory relationship between miR-122 and SCD at hepatocyte level. pEGFP-C1-3Flag-SCD-3′-UTR and 50 nM or 100 nM miR-122 mimic or same dose of miR-122 negative control was co-transfected into hepatocytes by lipofectamine 2000. (C) Protein expressions of SCD at hepatocyte level as determined by western blotting. (D) Transcript levels of SCD at hepatocyte level as determined by qRT-PCR. ∗P < 0.05 indicates significant differences between values obtained before and after injection or transfection (paired-samples t test). Different lowercase letters show significant differences among treatments at each sampling point (P < 0.05, Duncan’s multiple range test).