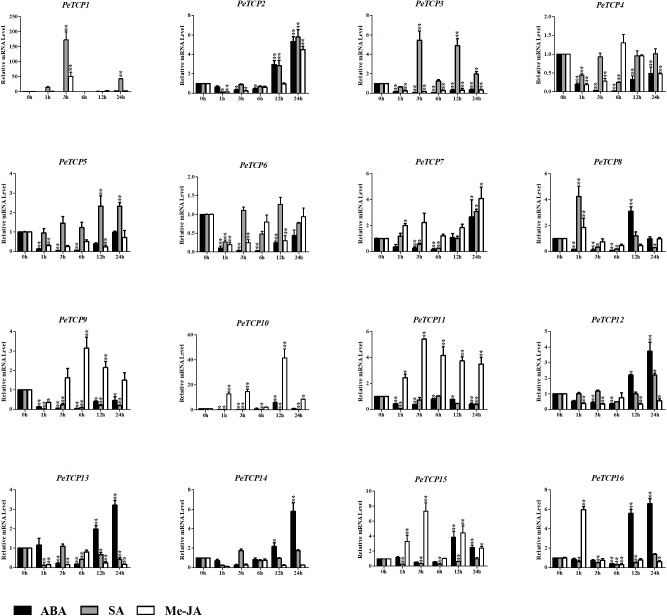
FIGURE 10.
Expression levels of PeTCPs under ABA, Me-JA, and SA treatment by qRT-PCR. The Y-axis and X-axis indicate the relative expression levels and the time courses of plant hormone treatments, respectively. Error bars, 6 ± SE. Asterisks indicate significant difference compared to the transcription level of control groups, as determined by Student’s t-test (∗p < 0.05, ∗∗p < 0.01).

