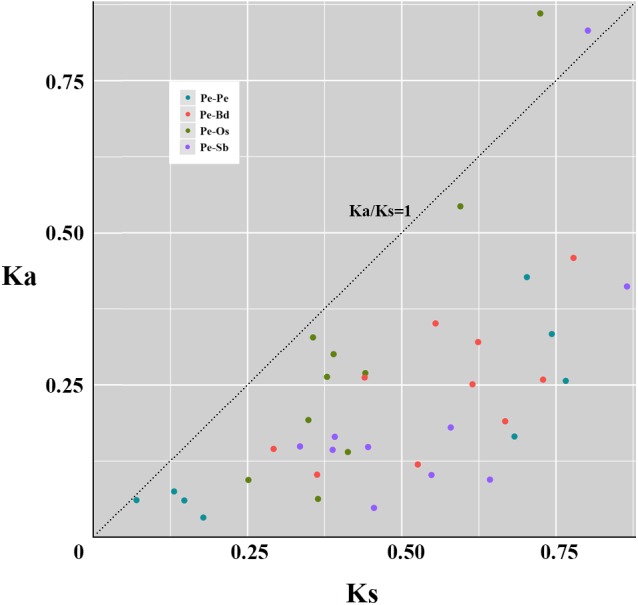
FIGURE 6.

Scatter plot statistics of Ka and Ks values among grass species. The black dotted line with slope one is used to show Ka/Ks = 1. A circle of different colors exhibits homologous pairs of different types. Pe-Pe: paralogous pairs of PeTCPs; Pe-Os: orthlogous pairs of TCPs between moso bamboo and rice; Pe-Bd: orthlogous pairs of TCPs between moso bamboo and Brachypodium distachyon; Pe-Sb: orthlogous pairs of TCPs between moso bamboo and Sorghum.
