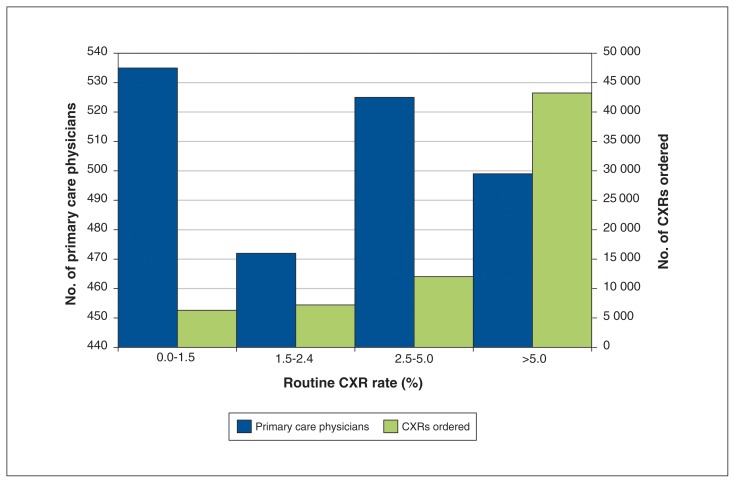
Figure 2:
Frequency distribution of family physicians in Ontario according to their routine chest x-ray (CXR) ordering rate with corresponding total volume of CXR ordered per rate-based quartile from 2010/11 to 2014/15. Note that the x-axis is divided into quartiles based on physician CXR ordering rate.

