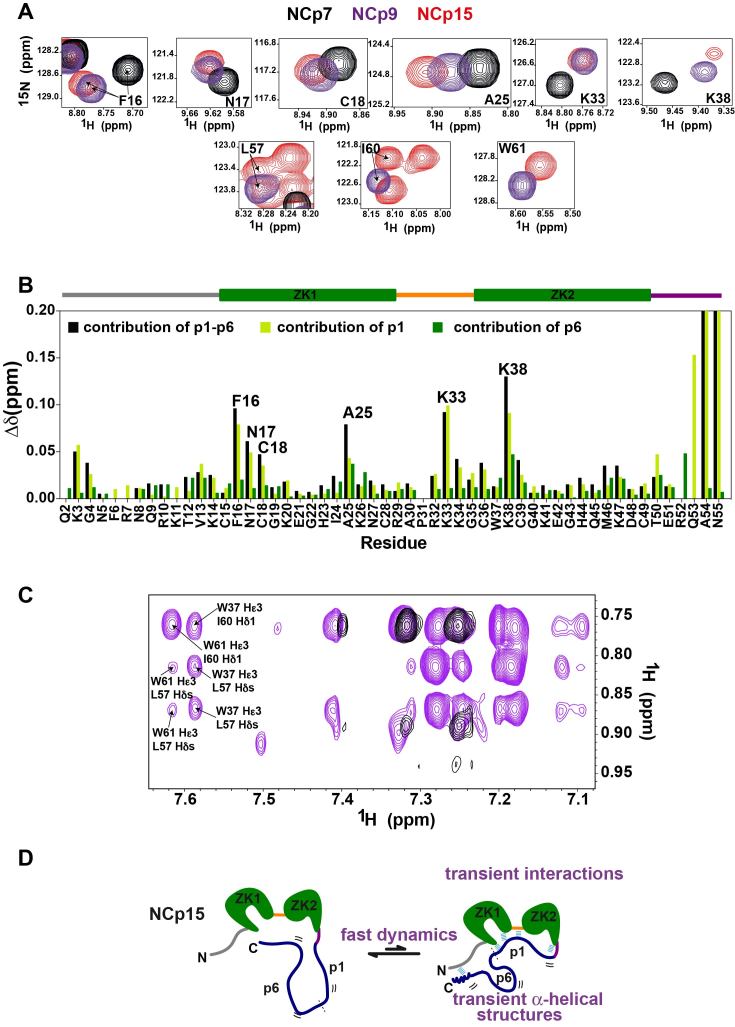
Figure 2.
Transient interactions between p1–p6 and NCd domains highlighted by NMR data measured on the precursor and mature forms of the NCd. (A) Peaks of F16, N17, C18, A25, K33 amide groups in NCp7 (black), in NCp9 (purple) and in NCp15 (red); and peaks of L57, I60 and W61 amide groups in NCp9 (purple) and in NCp15 (red), all extracted from 1H–15N BEST-TROSY. (B) Contributions of p1–p6 (black bars), p1(light green bars) and p6 (dark green bars) to NCd chemical shift perturbations measured for the amide groups. The p1–p6 (respectively p1) contributions were calculated as the difference in chemical shifts of NCd amide groups (combined 1H/15N shifts) between NCp15 (respectively NCp9) and NCp7, the p6 contributions were calculated as the difference in chemical shifts of NCd amide groups (combined 1H/15N shifts) between NCp15 and NCp9. The delimitation of the different regions in NCd is indicated as a drawing placed above the graphs using the color code of Figure 1A. (C) 2D NOESY (150 ms) measured in D2O on NCp9 (in purple) showing NOEs between proton Hϵ3 of W37 and protons of methyl groups of L57 and I60, the same region of a 2D NOESY recorded in the same conditions on NCp7 is displayed in black. (D) Schematic summarizing the interactions between NCd, p1 and p6 highlighted by the NMR chemical shifts and the dynamics analysis of the NCd in NCp7, NCp9 and NCp15.

