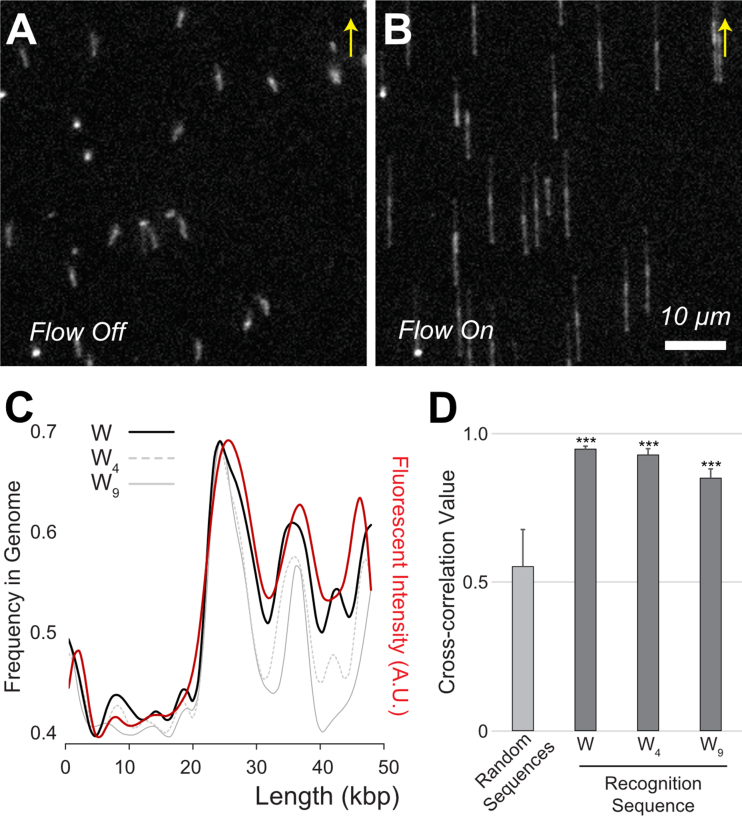
Figure 2.
TAMRA-pPy-stained λ DNA tethered on the surface of a flow cell. (A) Free-floating λ DNA (48.5 kb) molecules with a mushroom-like conformation in the flow off condition. (B) Fully elongated λ DNA molecules with a flow of 100 μl/min. Arrows indicate flow direction. Scale bar 10 μm. (C) Comparison of experimentally measured fluorescence intensity (red) with in silico sequence frequencies from the λ genome sequence. The black solid line represents A/T (W), the gray dotted line indicates four consecutive A/T (W4), and the grey solid line is W9. (D) Cross-correlation (cc) coefficient values calculated from the alignment of 20 molecular images with the genome using three kinds of binding sequences (W, W4 and W9). The control cc was obtained from 100 computer-generated random sequences (***P < 0.0001 for random-sequences paired t-test).

