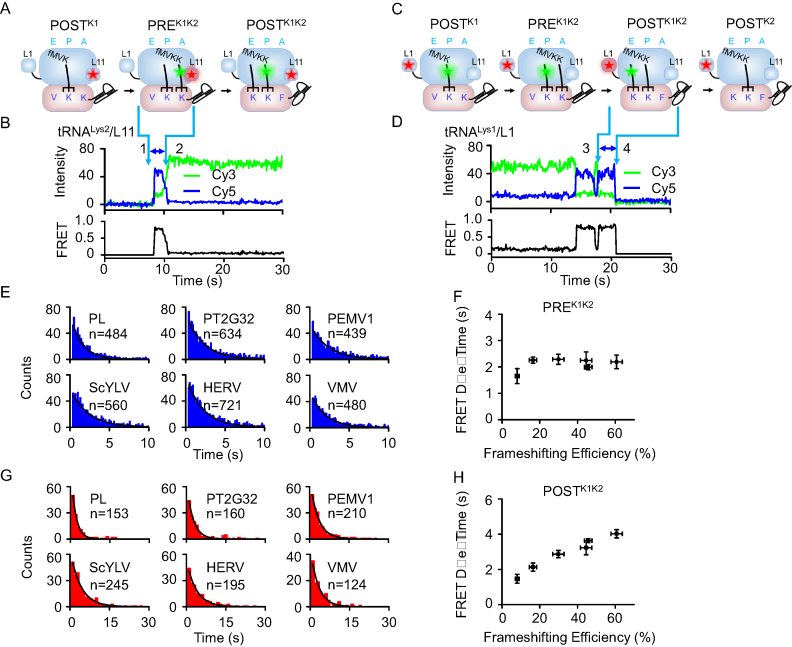
Figure 4.
Elongation rates of ribosomes on slippery mRNAs with different pseudoknots sequence during the first pseudoknot-unwinding cycle. (A) Schematic drawings of ribosomal complexes from POSTK1 to POSTK1K2. (B) Typical real-time ribosome translation trace measured using Cy3-tRNALys2/Cy5-L11 FRET pair. Accommodation of Cy3-tRNALys2 into the A-site led to spontaneous appearance of Cy3 and FRET signals (arrow 1). Translocation from PREK1K2 to POSTK1K2 caused decrease of FRET accompanied by increase of Cy3 signals (arrow 2). The high FRET state between arrows 1 and 2 corresponded to PREK1K2 complex. (C) Schematic drawings of ribosomal complexes from POSTK1 to POSTK2. (D) Typical real-time ribosome translation trace measured using Cy3-tRNALys1/Cy5-L1 FRET pair. Arriving of Cy3-tRNALys1 into the E-site led to formation of the high FRET state (arrow 3). Dissociation of Cy3-tRNALys1 from the E-site caused spontaneous disappearance of Cy3 and FRET signals (arrow 4). The last high FRET state between arrows 3 and 4 corresponded to POSTK1K2 complex. (E) Dwell time distributions of PREK1K2 complexes during ongoing elongation. (F) Plot of PREK1K2 dwell time versus frameshifting efficiency. (G) Dwell time distributions of POSTK1K2 complexes during ongoing elongation. (H) Plot of POSTK1K2 dwell time versus frameshifting efficiency. n is the number of events. Dwell times were extracted by single exponential fitting of dwell time distributions. Error bars were standard errors.

