Figure 2.
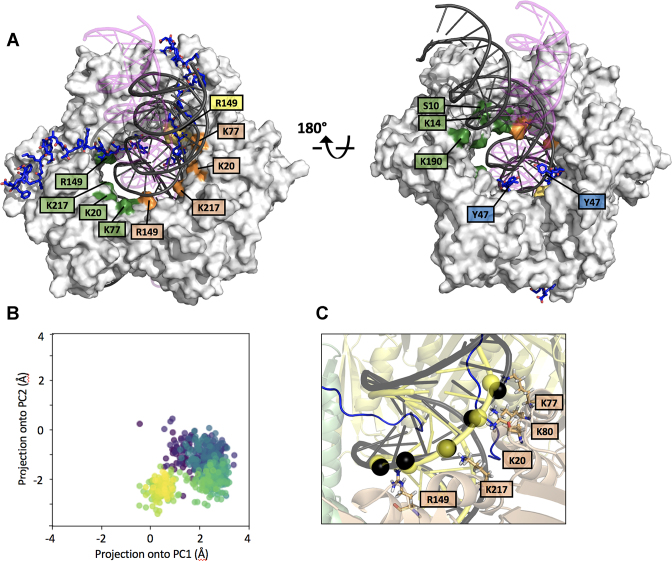
MD simulation of PCNA bound to two p1547–70 peptides and a 40 bp DNA (A) Superposition of the initial and equilibrium states of the MD trajectory. PCNA is shown as a gray surface and DNA as a ribbon. The DNA in magenta (with transparency), and black correspond to the initial and equilibrium states of the simulation, respectively. PCNA residues whose side chains are engaged in polar contacts with DNA phosphates are labeled. Residues of different PCNA subunits are colored in green, yellow and wheat. (B) Principal Component Analysis of the evolution of the DNA position inside the PCNA ring (see Methods section for details). The centre of DNA in each trajectory frame was projected onto the first 2 components of the subspace composed of the centres of the 3 PCNA subunits. Each frame is coloured using the viridis colormap, which goes from dark purple for the first frames to yellow for the last ones. In the initial frame, DNA is close to (0,0), the centre of the three PCNA chains, and it quickly translates to a non-centered position. The final position is retained due to the stabilizing interactions reported in Supplementary Figure S4. (C) Close-up of the equilibrium state of the MD trajectory showing the PCNA–DNA interface. Interacting PCNA side chains and DNA phosphates (interatomic side chain nitrogen – DNA phosphorus distance < 4 Å) are shown as sticks and black spheres, respectively. DNA in yellow corresponds to the position in the crystallographic PCNA–dsDNA binary structure (5), with interfacial phosphates shown as spheres.

