Figure 4.
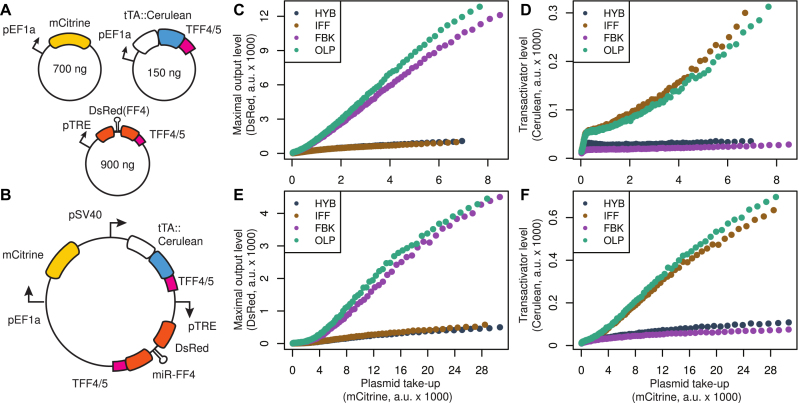
Characterization of the cybergenetic circuits. (A) Implementation of the four controller topologies using separate plasmids. To avoid resource burden induced by overexpression of tTA::Cerulean, we used 150 ng of tTA::Cerulean plasmids in the transfection mixes, while the amounts of mCitrine and DsRed plasmids were 700 and 900 ng, respectively. (B) Implementation of the four controllers on a single plasmid each. (C–F) Experimental plasmid-takeup/MOL (left) and plasmid-takeup/TA (right) functions of the controllers on separate plasmids (top) or single plasmids (bottom). The colors indicate different topologies: hybrid feedback-feedforward (steel), feedback-only (lilac), feedforward-only (dark gold) and open loop (aqua). The curves were obtained by pooling data from N = 3 replicates per condition, each of which had an average of ∼460 000 positively transfected cells (with above-background mCitrine expression).

