Figure 2.
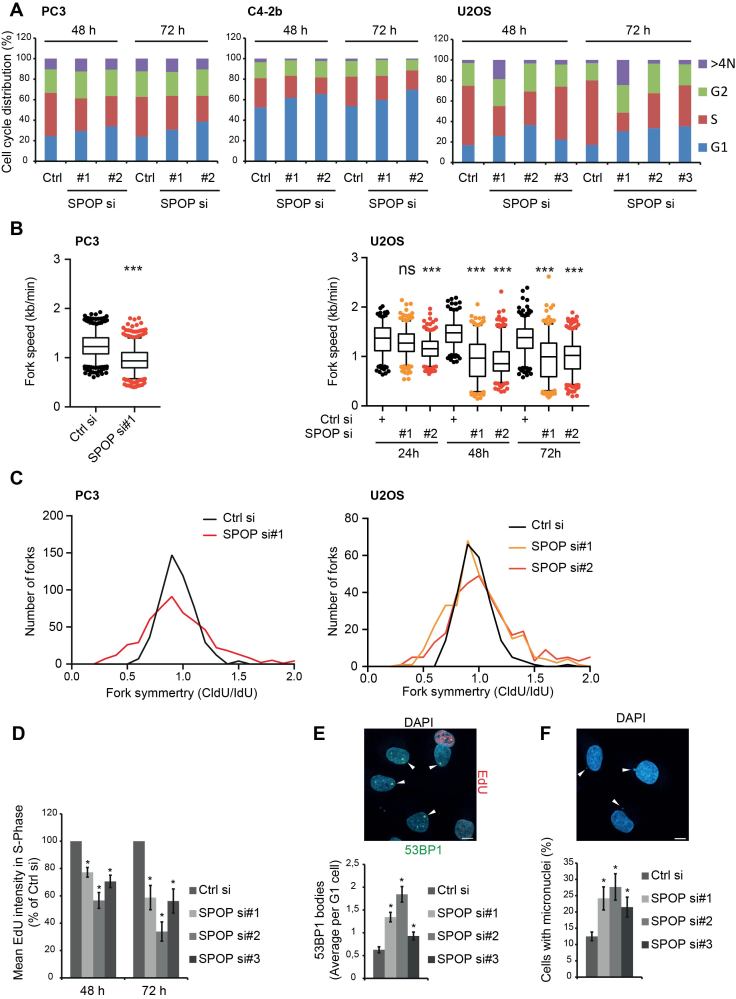
SPOP knockdown leads to replication stress and aberrant cell cycle progression. (A) C4-2b, PC3 and U2OS cells were transfected with siRNA. At the indicated time points, the cells were pulsed for 30 min with EdU and fixed for immunofluorescence analysis for DAPI and EdU. QIBC was performed and cell cycle profiles were derived from this. PC3 and U2OS cells were transfected with siRNA for the indicated times, incubated for 20 min with CldU and IdU, followed by DNA fiber preparation, staining, and quantification. Total fork speed was determined (B) and fork symmetry is shown for the 48 h time point (C). Significance was determined by a two-tailed t test: ***P < 10−14. U2OS cells were transfected with siRNA. At the indicated time points, the cells were pulsed for 30 min with EdU and fixed for immunofluorescence analysis for DAPI, EdU and 53BP1. QIBC was performed and cell cycle profiles were derived from this. The mean EdU intensities of cells in S-Phase were quantified by QIBC (D). QIBC analysis of the 72 h time points was used to quantify 53BP1 bodies in G1 cells (E) and micronuclei were scored manually (200 cells analyzed per sample) (F). Example pictures are shown above. Scale bars, 10 μm. Error bars represent SD, n = 3. Significance was determined by a two-tailed t test: *P < 0.05.

