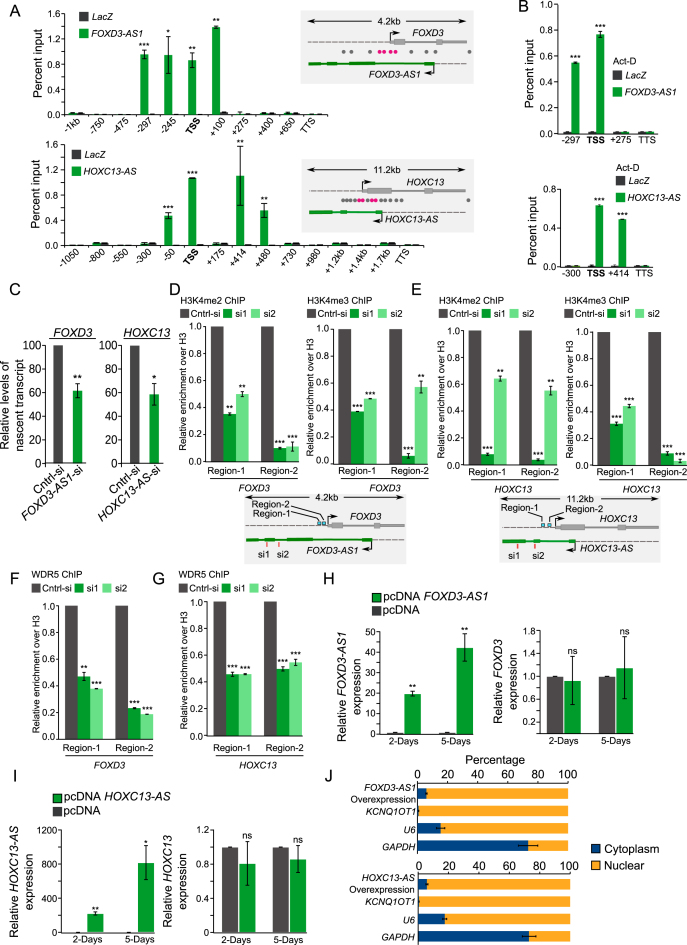
Figure 4.
Active XH lncCARs promote transcription of their protein coding partners. (A and B) Promoter targeting of active XH lncCARs detected by ChOP. A) qPCR analysis of ChOP pull-downs, performed using FOXD3-AS1 and HOXC13-AS antisense probes, with primers over TSS (transcription start sites), regions spanning upstream and downstream of TSS and over transcription termination sites (TTS) of FOXD3 and HOXC13 genes in BT-549 cells. The ChOP pull-down with LacZ antisense oligo, used as a negative control (grey bars). Specific enrichment pattern for each of the XH lncCARs is depicted in green bars. The schematic in the right of the bar graph represents the genomic locations of the respective primers (grey: not enriched and rosetta: showing enrichment). Data are shown as mean ± SD (n = 2 biological replicates). *P < 0.05, **P ≤ 0.01 and ***P ≤ 0.001. (B) Similar qPCR analysis of ChOP pull-downs using FOXD3-AS1 and HOXC13-AS antisense probes upon ActD treatment in BT-549 cells. Data are shown as mean ± SD (n = 2 biological replicates). *P < 0.05, **P ≤ 0.01 and ***P ≤ 0.001. (C) RT-qPCR analysis to detect relative levels of nascent FOXD3 and HOXC13 transcripts by Click-iT at 48 hours after the knockdown of FOXD3-AS1 and HOXC13-AS. Bar graph depicts the level of nascent protein coding transcripts upon removal of their respective active XH lncCARs. Data represent the mean ± SD of two independent biological experiments. * if P ≤ 0.05 and ** if P ≤ 0.01. (D and E) ChIP-qPCR analysis of the enrichment of H3K4me2 and H3K4me3 at the promoter region of FOXD3 (D) and HOXC13 (E) upon down regulation of active XH lncCAR FOXD3-AS1 and HOXC13-AS respectively. Fold enrichment of H3K4me2 and H3K4me3 was normalized to histone H3 and IgG. After normalization the ChIP data was represented as relative enrichment compare to control siRNA.The locations of ChIP primers used are depicted in schematic in the bottm of each bar graph. Data are shown as mean ± SD (n = 3 biological replicates). **P ≤ 0.01 and ***P ≤ 0.001. (F and G) ChIP-qPCR analysis of enrichment of WDR5 at the promoter region of FOXD3(F) and HOXC13 (G) upon downregulation of active XH lncCAR FOXD3-AS1 and HOXC13-AS respectively. Fold enrichment of WDR5 was normalized to histone H3 and IgG. After normalization the ChIP data was represented as relative enrichment compare to control siRNA. The ChIP primers used in the experiment are same as described in panel D–E. Data are shown as mean ± SD (n = 3 biological replicates). **P ≤ 0.01 and ***P ≤ 0.001. (H and I) FOXD3-AS1 and HOXC13-AS overexpression: RT–qPCR analysis of FOXD3 expression, upon ectopic overexpression of FOXD3-AS1 (H) and HOXC13-AS transcript (I) respectively, at Day 2 and Day 5 post transfection in BT-549 cell line. pcDNA empty vector transfection used as a control. Data represent the mean ± SD. of two independent biological experiments. P-values has been denoted as * if P ≤ 0.05, ** if P ≤ 0.01. ns denotes non-significant. (J) Cell fractionation in BT-549 cells show distribution of the overexpressed FOXD3-AS1 and HOXC13-AS transcripts. Data represent the mean ± SD of two independent biological experiments. GAPDH serves as positive control for cytoplasmic fraction, U6 and KCNQ1OT1 serves as positive control for nuclear fraction.

