Figure 1.
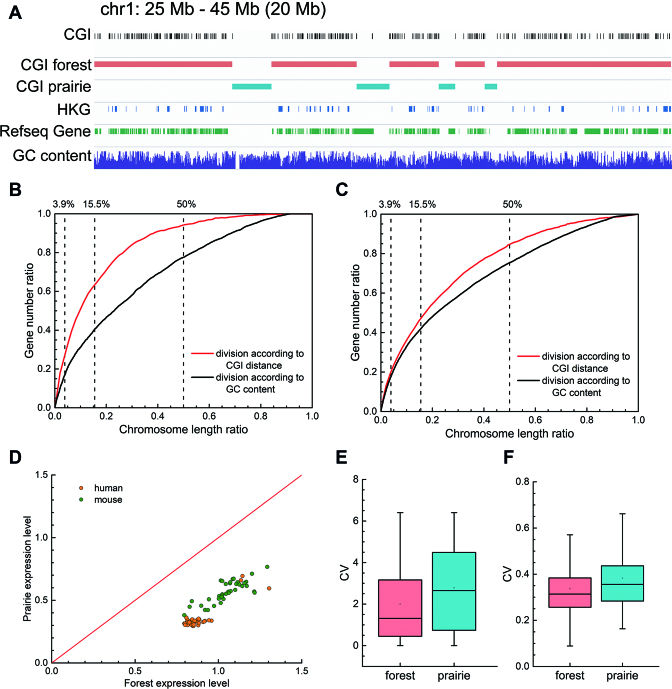
The genetic features of CGI forests and prairies. (A) IGV snapshot for a representative 20-Mb region on human chromosome 1 showing that CGI forests are where CGIs cluster, and are enriched in genes, especially housekeeping genes. (B and C) The characteristic curve of the division by CGI distance and by GC content in regard to (B) housekeeping genes and (C) all genes. For GC content, each point on the curve shows the length ratio of regions with GC content above a threshold and the proportion of genes in these regions. For CGI distance, each point shows the length ratio of regions with neighboring CGI distances lower than a threshold, and the corresponding ratio of genes located inside. A higher AUC means that the feature is enriched at a shorter chromosome length, thus indicating a more effective feature enrichment strategy. (D) Mean gene logarithm expression levels in forests and prairies of different human and mouse samples. (E and F) The boxplot for CVs of expression levels in human samples for (E) all genes and (F) housekeeping genes.

