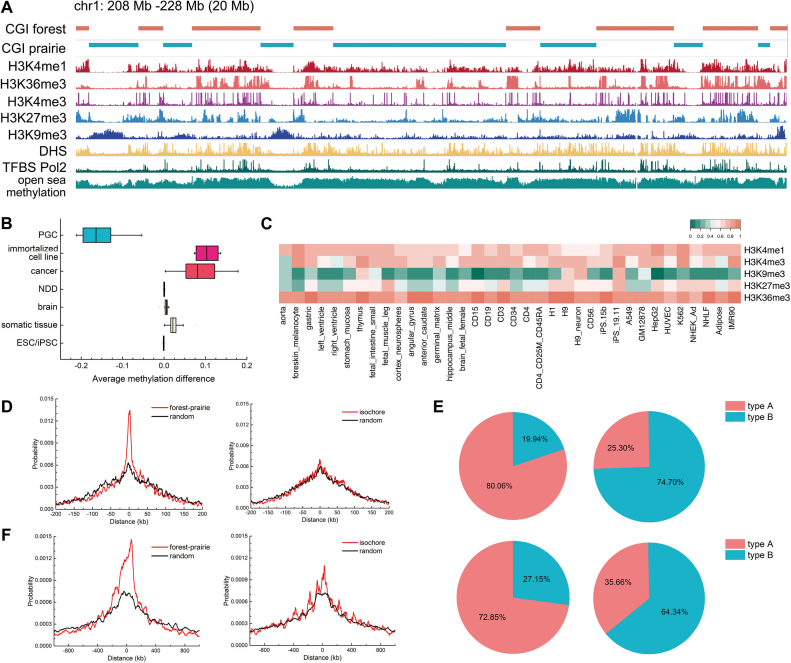
Figure 2.
The epigenetic and structural features of forests and prairies. (A) IGV snapshot for a representative 20-Mb region on human chromosome 1 showing the open sea DNA methylation level, distribution of histone marks, DHS and TFBS in forests and prairies of IMR90 cell line. (B) Boxplot for the average forest open sea methylation level difference in different sample types. Positive difference suggests that forests have higher methylation level than neighboring prairies, and vice versa. (C) Heatmap of F–P enrichment ratio of different histone marks for IMR90 cell line. (D) Distance distribution of F–P boundaries (left) and isochores boundaries (right) to TAD boundaries. (E) The composition of type A and B in forest (upper left) and prairie (upper right), as well as in high GC content regions (lower left) and low GC content regions (lower right). (F) Distance distribution of F–P boundaries (left) and isochore boundaries (right) to compartment boundaries.

