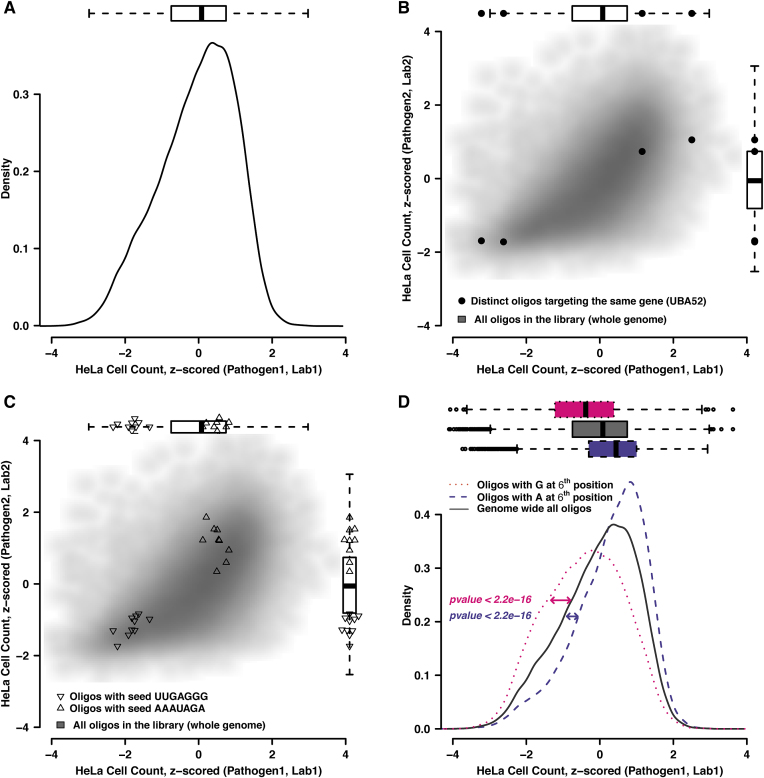
Figure 1.
Different types of off-target effects of siRNAs in RNAi pathogen screens. (A) Cell number distribution from a genome-wide pathogen screen (here, Brucella abortus). (B) On-target reproducibility of the cell-number phenotype. The four data points highlighted in black represent four distinct siRNAs targeting the same gene, shown against the genome-wide reproducibility of identical oligos in distinct screens (gray scatter plot of 69,000 siRNAs targeting the human genome, in two pathogen screens; Pathogen1: Brucella abortus and Pathogen 2: Uukuniemi virus). (C) Strong and consistent seed-mediated off-target effects of siRNAs across RNAi screens. The two clusters represent two different seed sequences, one increasing the cell number and the other decreasing it. All data points in each cluster represent oligos targeting different genes but containing the respective seed sequence of the cluster. Background scatter as in (B). (D) Shifted cell-count distributions, caused by the presence of a single nucleotide at a specified position. Three different cell count distributions are represented by three colored line types. The black solid line represents the cell count of all the siRNAs in a genome-wide screen (Brucella abortus screen), pink dotted and violet dashed lines represent cell count distributions of all those siRNAs in that same screen that have either adenine at 6th position or guanine at 6th position, respectively. In all panels, the box-plots denote the percentiles 25%, 50% and 75%, respectively, with their whiskers extending to the highest or lowest data points that are at most 1.5 times the box distance away from the box.

