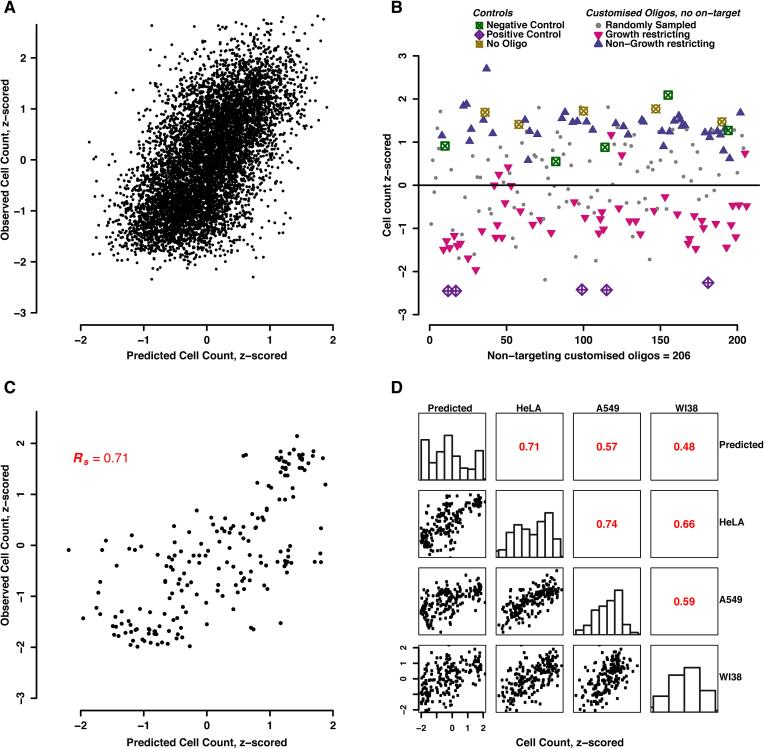
Figure 3.
Predicting cell-number reductions from siRNA sequence. (A) A linear model was trained on 90% of the Uukuniemi genome-wide screening data and used to predict the remaining 10% of data. Correlation plot between observed and predicted values for cell count upon transfection. (B) Experimental design for testing the predictor with previously unobserved, arbitrary siRNA sequences. Oligos are separated by design-class, and observed phenotypes are shown. (C) Correlation plot between observed and predicted values of customized siRNAs in HeLa CCL2 cells. (D) Experimentally validating the model prediction across cell lines. The linear model trained on a genome-wide screen in HeLa CCL2 cells (Brucella abortus screen) was used to predict the cell counts across different cell lines. Summary/correlation plots between the observed and predicted values of customized siRNAs across cell lines. The small histograms in the center describe the distribution of data points along the x-axis, per column.

