Figure 1.
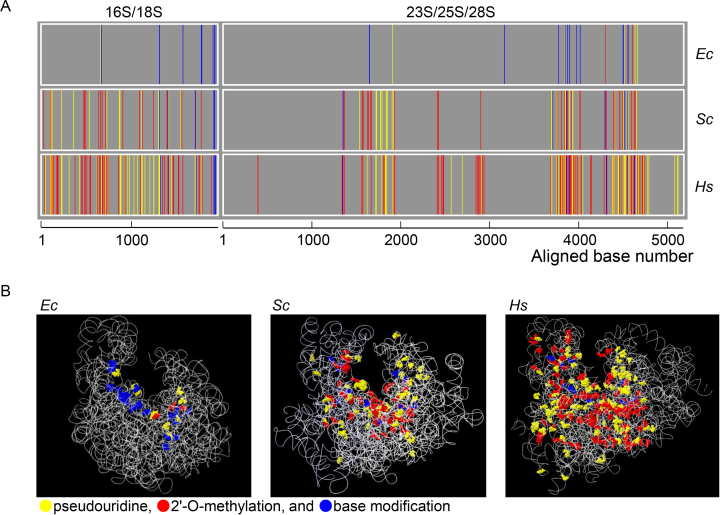
(A) One-dimensional PTM maps of the E. coli (Ec), budding yeast (Saccharomyces cerevisiae, Sc) and human (Hs) rRNAs. The PTM sites were plotted against rRNA sequences aligned by the sequence homology (shown in Supplementary Table S9) obtained by using the Clustal Omega software (https://www.ebi.ac.uk/Tools/msa/clustalo/). The PTM sites are colored yellow (pseudouridine), red (2′-O-methylated nucleoside), and blue (base-modified nucleoside). (B) Three-dimensional PTM maps of the Ec, Sc, and Hs ribosomes. The PTM sites were assigned to the three-dimensional structure of the rRNAs obtained from 4YBB.pdb (for Ec), 3U5B.pdb (Sc) and 4UG0.pdb (Hs). The RNA backbone is shown as a ribbon, and PTM sites are colored as in (A).

