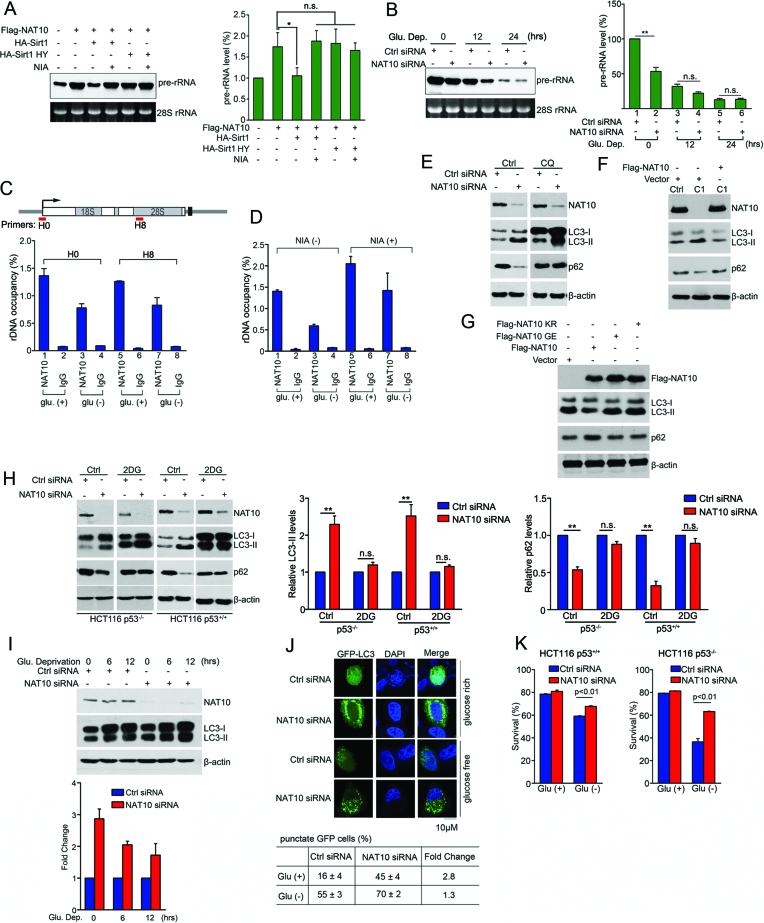
Figure 2.
Deacetylation of NAT10 inhibits rRNA biogenesis and releases autophagy induction after glucose deprivation. (A) HCT116 cells were transfected with the indicated plasmids. After 24 h, pre-rRNA levels were determined by Northern blot (left) and RT-qPCR (right). Error bars indicate the SEM (n = 3). *P < 0.05. n.s., no significance. (one-way ANOVA). (B) HCT116 cells were transfected with the indicated siRNAs and cultured in glucose-free medium for the indicated amounts of time. The cells were harvested, and pre-rRNA levels were determined by Northern blot (left) and RT-qPCR (right). Error bars indicate the SEM (n = 3). *P < 0.05. n.s., no significance. (two-tailed t-test). (C) HEK293T cells were cultured in glucose-rich or glucose-free medium. rDNA occupancy by NAT10 was evaluated by ChIP experiment. Error bars indicate the SEM (n = 3). (D) HEK293T cells cultured in glucose-rich or glucose-free medium were treated with nicotinamide. rDNA occupancy by NAT10 was evaluated by ChIP experiment. Error bars indicate the SEM (n = 3). (E) HCT116 cells were transfected with the indicated siRNAs. After treatment with chloroquine (CQ, 100 μM), the cells were harvested, and Western blotting was performed to evaluate the indicated proteins. (F) HCT116 Ctrl or HCT116 NAT10 KO cells were transfected with the indicated plasmids. Cell lysates were subjected to immunoblot analysis using the indicated antibodies. (G) HCT116 cells were transfected with the indicated plasmids. Cell lysates were subjected to Western blot using the indicated antibodies. (H) HCT116 p53+/+ or HCT116 p53−/− cells were transfected with the indicated siRNAs. The cells were treated with 2-DG and harvested. Western blotting was performed to evaluate the indicated proteins. Densitometry scanning analyses of the LC3 and p62 bands standardized to β-actin are summarized from three independent experiments and shown on the right. Error bars indicate the SEM (n = 3). **P < 0.01. n.s., no significance. (two-tails t-test) (I) HCT116 cells were transfected with the indicated siRNAs and cultured in glucose-free medium for the indicated amounts of time. Western blotting was performed to evaluate the indicated proteins. Densitometry scanning analyses of LC3 bands standardized by β-actin are summarized from three independent experiments and shown in the lower panel. Error bars indicate the SEM (n = 3). (J) HCT116 cells transfected with the indicated siRNAs and GFP-LC3 were cultured in glucose-free medium for 18 h. GFP-LC3 distribution was assessed by fluorescence microscopy. The percentage of punctate GFP cells represents the number of cells with punctate GFP-LC3 among 100 GFP-LC3-expressing cells. Data represent the mean ± SD from three independent experiments performed in triplicate (lower table). Scale bars, 10 μM. (K) HCT116 cells were transfected with the indicated siRNAs and cultured in glucose-free medium for 18 h. The cell viability was measured by FACS analysis after Annexin V and propidium iodide (PI) double-staining. Error bars indicate the SEM (n = 3). P-values were calculated using the two-tailed t-test. See also Supplementary Figure S2.

